August 2026 Gold Outlook: How Three Data Prints Move Prices
Key Takeaways
- Gold is trading near $4,380 as of mid-August, roughly 10% above early-August lows near $4,000 — its largest monthly gain since January’s record run.
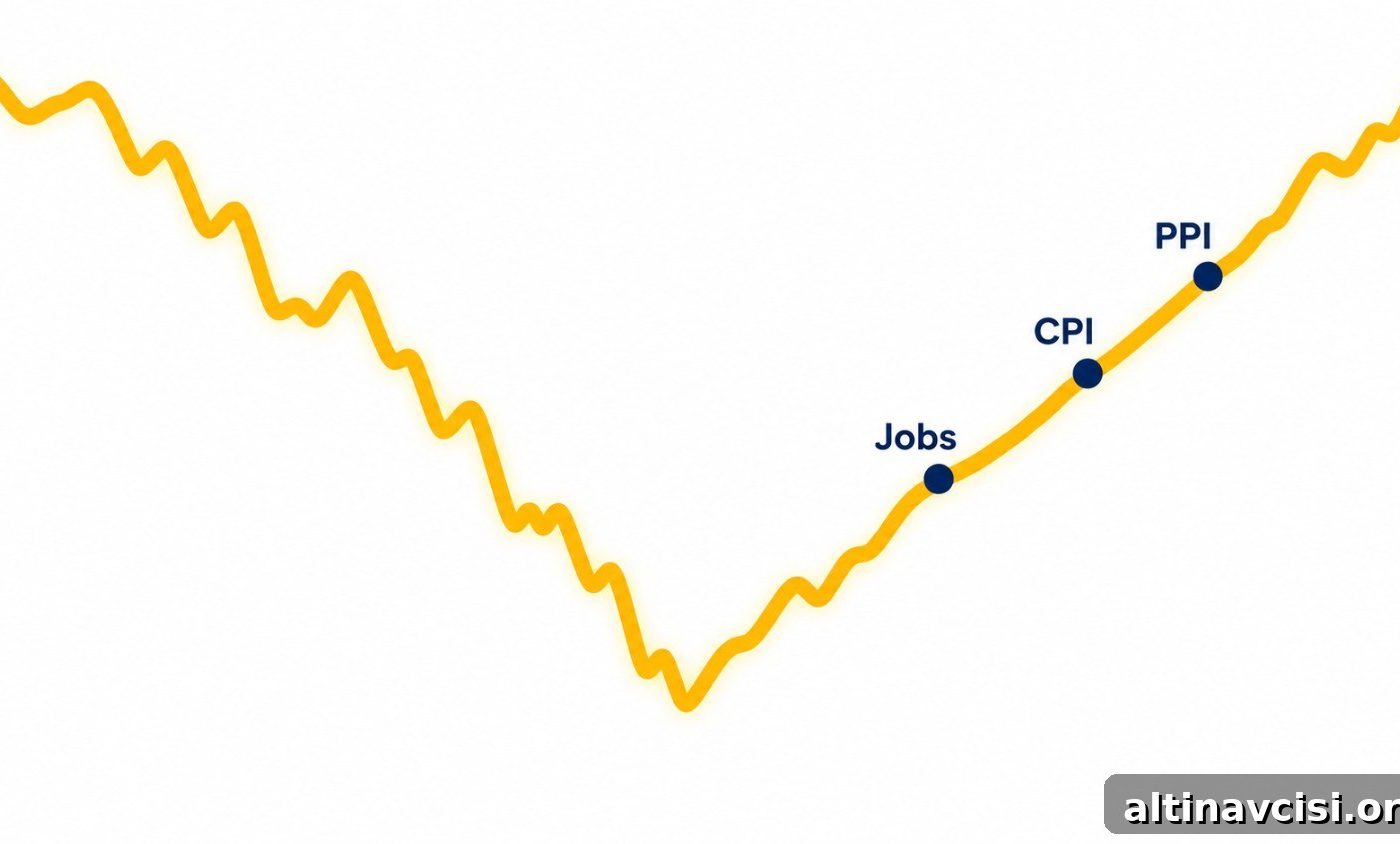
- Three economic releases in a single week changed the September rate-hike outlook: July nonfarm payrolls missed expectations by 106,000 jobs, July CPI slowed to 3.4% year-over-year, and July PPI was flat. These prints pushed September hike odds down from about 50% to roughly 31% on the CME FedWatch tool.
- Central banks bought a net 288.9 tonnes of gold in Q2 2026 — a quarterly record and a 62% increase year-over-year — even while the metal’s price was falling. That sovereign buying at lower prices provides a structural floor under the current rally.
- The next decisive events are the August CPI release on September 10 and the Federal Open Market Committee meeting on September 15–16; those two prints will determine whether August’s rally continues or reverses.
- Major institutions have trimmed year-end targets from January highs, yet several still project prices above current levels — for example, Goldman Sachs at $4,900, JPMorgan at $4,500 (Q4), and Bank of America at $4,360.
Gold began August near $4,000 and, by mid-month, was trading around $4,380 — on pace for its strongest monthly gain since January. This is the third installment in our monthly Gold Price Outlook series. Earlier editions examined the correction that followed the January highs and explained why the long-term structural case for gold remained intact. August’s move, by contrast, was driven by a concentrated shift in rate expectations after three back-to-back economic releases pushed gold to a ten-week high. Below is a concise explanation of what happened and what it means for investors and physical holders.
Why Did the Gold Price Rise in August 2026?
The rise traces to a single root cause with three immediate drivers.
The Root Cause: Real Yields
Real yields — the return on bonds and cash after inflation — are the key variable for gold. Because gold does not pay interest, rising real yields make yield-bearing assets more attractive relative to bullion. Conversely, when expectations for rate hikes decline and real yields compress, gold becomes relatively more attractive. Approximately 90% of annual gold demand stems from store-of-value, reserves, and jewelry, so the metal is especially sensitive to changes in real yield expectations.
The Three Prints That Moved the Market
Branch one — the jobs report: On August 7, the U.S. nonfarm payrolls report showed a loss of 23,000 jobs in July versus a consensus expectation of a gain near 83,000. The large miss, together with sizeable downward revisions to prior months, reduced the apparent momentum in labor-market growth and weakened the case for an imminent Fed rate increase.
Branch two — July CPI: On August 12, consumer prices rose just 0.1% in July, leaving the year-over-year rate at 3.4% (down from 3.5% in June). Core CPI rose 0.2% month-over-month and 2.5% year-over-year. This marked the second consecutive monthly deceleration in headline inflation and encouraged traders to price in a higher likelihood the Fed would pause rather than hike in September.
How PPI Sealed the Case
Branch three — July PPI: On August 13, producer prices were flat for the month, with headline PPI unchanged and core PPI below consensus. While a narrower core measure that excludes food, energy, and trade services did show some acceleration, the headline flat reading reinforced the view that earlier energy-driven inflation pressures were easing. Together with the jobs and CPI data, PPI materially lowered the odds of a September rate hike.
After these three releases, CME market pricing moved September hike odds from about 50% to roughly 31%. Gold reacted quickly: after trading near $4,000 at the start of August, it peaked intraday at $4,509 on August 13 before settling near $4,380.
The Knowledge That Changes Everything
Two essential guides — free. Learn why gold matters and why fiat currencies can lose value over time.
Are Central Banks Still Buying Gold in 2026?
Yes. Central-bank buying in Q2 2026 is one of the most important structural developments supporting gold.
The World Gold Council reported net purchases of 288.9 tonnes in Q2 2026, a 62% increase compared with Q2 2025 and the strongest second-quarter total on record. Importantly, that buying occurred while gold prices were falling from January’s highs. Sovereign reserve managers treat gold as a long-term reserve asset, not a short-term trading instrument. Lower prices present an opportunity to accumulate reserves more cheaply.
Who Was Buying — and Who Was Selling
Poland led net purchases with 51 tonnes in Q2, bringing its first-half total to 82 tonnes as it continues toward a self-declared target. The People’s Bank of China added 33 tonnes, marking its largest single-quarter purchase since late 2023 and extending its accumulation streak to many consecutive months. Uzbekistan, Kazakhstan, Jordan, and the Czech Republic also added meaningful amounts. On the sell side, Russia reduced holdings by 22 tonnes, and Turkey slowed the pace of selling.
Total central-bank purchases for the first half of 2026 reached 345 tonnes. Retail-focused gold ETFs recorded net outflows during Q2, particularly in North America, but recent inflows into major funds suggest that ETF sentiment is beginning to stabilize. The key structural takeaway: sovereign demand soared at lower prices while retail selling dominated flows, creating an asymmetry that underpins the current rally.
What Does the September FOMC Meeting Mean for Gold?
The Fed’s September 15–16 meeting is the most important near-term event for gold. Two outcomes and their implications:
Fed holds rates: If the Fed holds the policy rate at 3.50–3.75% (the market-implied majority outcome), expectations for future rate increases would ease further and remove the primary headwind for gold. That would support a continuation of August’s momentum toward many institutional targets.
Fed raises rates by 25 bps: A 25-basis-point hike would raise real yield expectations and compress gold’s upside. The decision will hinge on inflation data released just five days earlier.
What Decides the Outcome: August CPI on September 10
The decisive data point arrives on September 10 with August CPI. A reading materially above recent levels could revive the hike case; a reading at or below the July pace would strengthen the argument for a hold. Markets view that CPI print as the single most important variable ahead of the FOMC meeting.
What Is the Gold Price Forecast for the Rest of 2026?
Institutional forecasters pared back the most aggressive January targets but remain generally constructive. Goldman Sachs, JPMorgan, and Bank of America have all reduced earlier estimates but still project year-end or Q4 levels above current prices. The World Gold Council’s mid-year valuation model placed base-case fair value around $4,100, with a tolerance band roughly between $3,895 and $4,305. Gold is trading above that midpoint, reflecting the market’s response to the recent compression of hike odds.
Three Structural Pillars Supporting Gold into Year-End
Three durable factors support gold through the remainder of the year:
1) Interest-rate constraints: A large federal debt burden raises the fiscal cost of higher interest rates and limits how far and how long a tightening cycle can stretch.
2) Central-bank accumulation: Record sovereign buying in Q2 shows long-term reserve managers are accumulating at lower prices, providing a structural demand floor.
3) Correction precedent: Historical corrections within bull markets have often preceded renewed advances. The January-to-June drawdown resembles past healthy consolidations rather than the end of a bull market. Meanwhile, mine supply growth has been modest and lags monetary expansion, supporting a favorable supply-demand balance over time.
What Should Gold Holders Watch in the Weeks Ahead?
The calendar through mid-September will shape the near-term outlook. Key items to monitor:
- August CPI on September 10 — the decisive data point ahead of the FOMC.
- The FOMC meeting on September 15–16 and the updated dot plot.
- Speeches and remarks from Fed officials (including events such as Jackson Hole), which markets will parse for signals about the September decision.
What This Means for Physical Gold Holders
For investors holding physical gold in secure, institutional storage, the recent data support maintaining a long-term allocation rather than reacting to short-term price swings. August’s three-print week shifted near-term rate pricing but did not alter the structural environment that favors gold as a monetary asset during periods of monetary uncertainty and sovereign reserve rebalancing.
Stay On Top of Gold & Silver Prices
Get important market alerts sent straight to your inbox.
People Also Ask
What is the gold price outlook for August 2026?
Gold entered August near $4,000 and rose roughly 10% month-to-date to about $4,380. Three consecutive data releases — the July jobs report, July CPI, and July PPI — reduced September rate-hike expectations and sent gold higher. The intraday August high reached $4,509 on August 13.
Why is the gold price rising in August 2026?
The price rise reflects a compression in expected real yields after weaker-than-expected jobs data, a slowing in CPI, and a flat PPI print. Because gold yields no interest, a decline in anticipated real yields improves its relative attractiveness, supporting higher prices.
What does the September FOMC meeting mean for gold?
If the Fed holds rates, gold would likely keep its recent momentum as the primary headwind subsides. If the Fed hikes, higher real yields would pressure gold. The August CPI reading, released five days before the meeting, will be central to the Fed’s decision.
Are central banks still buying gold in 2026?
Yes. Q2 2026 saw record second-quarter net purchases by central banks, totaling 288.9 tonnes — a clear demonstration of durable sovereign demand at lower prices and a structural support for the market.
What is the gold price forecast for year-end 2026?
Major institutions have lowered their earlier, more aggressive projections but remain broadly constructive. Example targets include Goldman Sachs at $4,900, JPMorgan at $4,500 (Q4), and Bank of America’s 2026 average near $4,360. The World Gold Council’s valuation model places fair value around $4,100 with a tolerance band extending higher if rate-hike expectations continue to ease.
SOURCES
1. Bureau of Labor Statistics — Employment Situation, CPI, and PPI summaries, July 2026.
2. World Gold Council — Gold Demand Trends Q2 2026 and Gold Mid-Year Outlook 2026 (July 2026).
3. CME Group — FedWatch Tool, September 2026 rate probabilities (August 14, 2026).
4. Federal Reserve Board — FOMC Statement, July 29, 2026.
5. Congressional Budget Office — Budget and Economic Outlook, FY2026 net interest projections.
6. GoldSilver — Live gold and silver spot prices.
Disclaimer: This article is for informational purposes only and does not constitute investment advice. Past performance is not indicative of future results. Always consult a qualified financial advisor before making investment decisions.
You May Also Like:
- 14 Million Coins Sold. Zero Design Changes in 35 Years. Here’s Why Investors Keep Choosing the Philharmonic.
- Two Inflation Numbers Come Out Every Month. The Fed Only Cares About One.
- Why Your Commodity ETF Gives You Almost No Gold — and What That Costs You
- American Gold Buffalo Coin: The Complete Guide to the U.S. Mint’s Purest Gold
- The Fed Printed $7 Trillion. Velocity Kept It Quiet. That’s Changing.
- Most 401(k)-to-Gold-IRA Rollovers Lose 20% Immediately. Here Is Why — and How to Avoid It.
- Gold Just Climbed to a 7-Week High. One Number Changed Everything.
Popular Topics
Picked from the archive
-
01
 Topics
Gold Prices Stabilize Amid Saudi-Iran Tensions
-
02
Topics
Why Gold Held Steady After Trump’s Economic Pressure on Iran
-
03
Topics
Oil Drops 11% as Gold Rises: What Investors Need to Know
-
04
Topics
3 Questions Investors Must Ask Before Buying Any Asset in 2026
-
05
Topics
Silver Surges Past $70 Amid Conflicting GDP Data
-
06
Topics
What’s Moving Gold and Silver Prices This Week
-
07
Topics
How FOMC Minutes and Jackson Hole Could Move Gold
-
08
Topics
Two Investors Ran Debt Math Separately and Chose 15 Percent Gold