Jobs Report Misses as Gold Hits $4,200 and Silver $62
Both gold and silver rallied to levels they had not seen since early July. This alignment was not random. Understanding why the metals moved — and why silver outpaced gold — matters more than the raw price change.
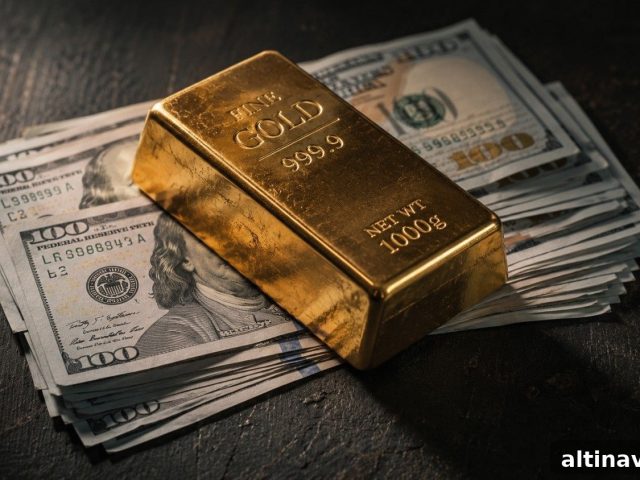
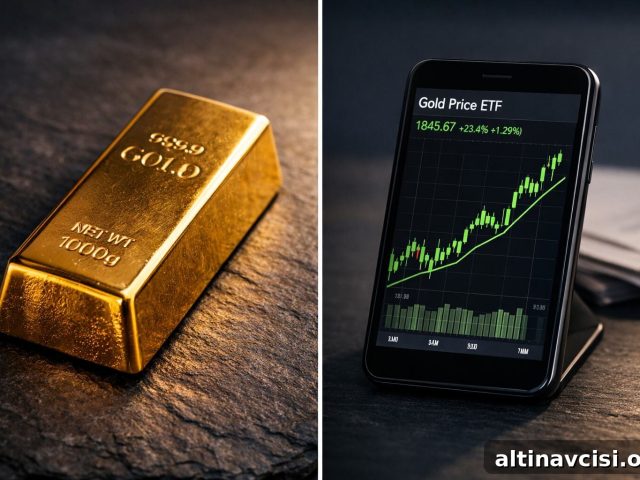
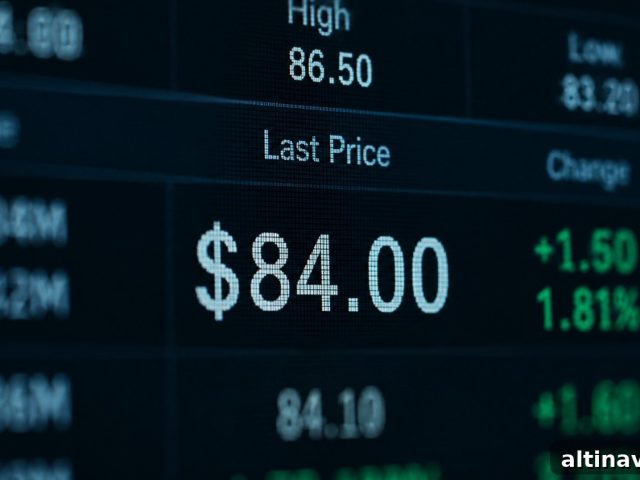
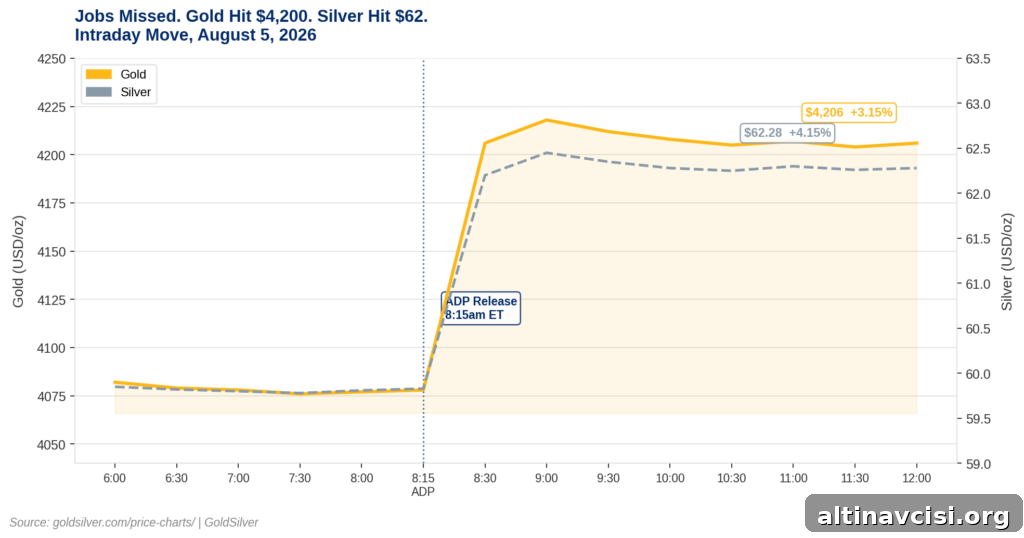
Gold was trading near $4,206 per ounce, up about 3.15% from the Wednesday open, while silver reached roughly $62.28 per ounce, a rise of about 4.15% from its open. Three distinct forces converged to push prices higher, and all three operate through the same macro channel: expectations for interest rates and the resulting effect on real yields.
Why did gold and silver surge on August 5, 2026?
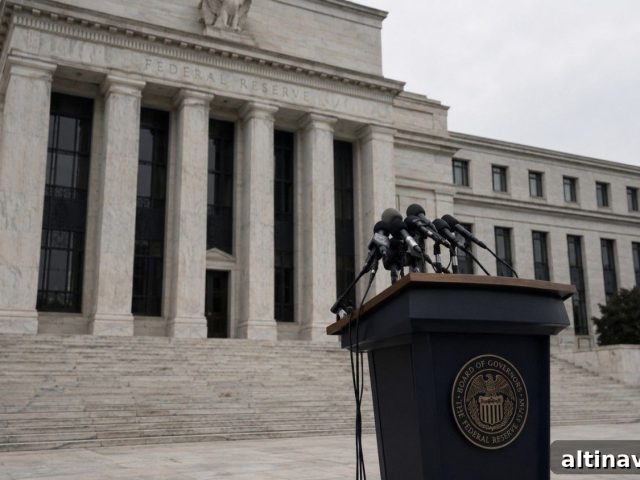
Force 1: The July ADP report shifted rate expectations. The ADP National Employment Report released at 8:15 a.m. ET showed private-sector payrolls increased by just 44,000 in July, well below consensus and a downward revision to June’s print. That weaker-than-expected result reinforced a recent trend of softening labor-market indicators, prompting traders to scale back the probability of a Federal Reserve rate hike in mid-September. When the market reduces the odds of further tightening, the entire yield curve reprices lower, which benefits precious metals.
Force 2: Falling hike odds compress real yields. This is the core transmission mechanism to gold. Real yields — the difference between nominal Treasury yields and breakeven inflation expectations — move inversely to gold. When investors price out a Fed hike, nominal yields tend to fall. If inflation breakevens remain steady, that combination lowers real yields, which historically supports higher gold prices. The ADP print didn’t merely help gold sentiment; it materially altered the expected path of real yields, the principal macro driver for gold.
Force 3: Optimism over a Hormuz deal eased the inflation outlook. Signals of progress toward a diplomatic agreement in the Strait of Hormuz reduced geopolitical risk premia and pushed Brent crude down by more than 2% on the morning of the move. Lower oil prices dampen near-term inflation pressure and further reduce the need for aggressive Fed tightening. That softer inflation backdrop reinforces the same real-yield channel that lifted gold.
Why is silver outperforming gold today?
Silver’s additional percentage of gains is meaningful rather than random. Two features give silver greater upside in this environment.
First, like gold, silver benefits from falling real yields and a softer dollar when rate-hike expectations decline. Second, silver has a large industrial component to demand — roughly 58% of annual demand is industrial, according to the World Silver Survey 2026. A soft but not collapsing labor report delivers a “Goldilocks” signal for industrial metals: the Fed is less likely to hike aggressively, but manufacturing activity remains intact. That combination effectively leverages silver’s response to the same macro forces that lift gold.
The gold-silver ratio moved down to about 67.5 from roughly 68 last week. By comparison, the long-term, roughly 50-year average is near 65, indicating silver still appears structurally cheap relative to gold. When silver outperforms while gold is already rallying, it tends to be a constructive sign for long-term holders of both metals.
What does this mean for the structural case?
Gold peaked at an all-time high of $5,589 per ounce on January 28, 2026. The subsequent roughly 25% correction was driven by a distinct sequence: geopolitical tensions pushed oil higher, inflating inflation expectations, which encouraged a hawkish Fed stance, lifted real yields and capped gold. The move on August 5 represents a partial reversal of that chain.
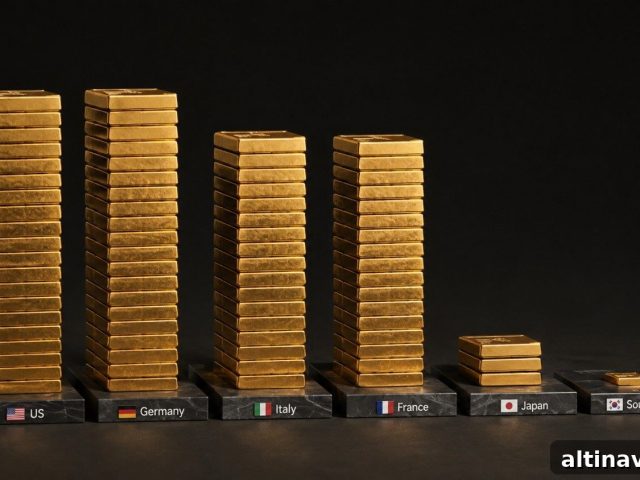
The structural demand base for gold remains intact. Central banks continued to buy gold through the correction: in Q2 2026 they purchased a quarterly record of 288.9 tonnes, up 62% year-over-year. That persistent buying means the price correction occurred while the demand floor for gold was rising — a constructive backdrop for future re-acceleration if macro conditions remain favorable.
What should you watch before Friday?
Friday’s Bureau of Labor Statistics Nonfarm Payrolls report is the key event. ADP provides directional guidance but has shown notable revisions versus the official BLS count; June’s ADP revision illustrated that divergence. A weak July NFP would significantly reduce September hike odds and likely push precious metals higher, while a strong payrolls print would revive hawkish expectations and pressure both gold and silver.
Also watch the ISM Services PMI and, in particular, the prices-paid subindex, which remains a sensitive indicator for inflationary pressure. Finally, monitor developments around the Hormuz negotiations and Iran’s public stance; progress on that front can keep oil and inflation pressure subdued, supporting the same yield-driven channel that lifted metals on August 5.
SOURCES
1. GoldSilver.com price charts — gold $4,206.35 and silver $62.284, as of August 5, 2026 (8:30 a.m. ET).
2. CME Group FedWatch Tool — September 2026 FOMC rate-hike probability.
3. ADP Research Institute — July 2026 National Employment Report (44,000 private-sector jobs; June revised to 95,000), released August 5, 2026.
4. CNBC coverage of markets reacting to oil and dollar moves on August 5, 2026.
5. World Gold Council — Gold Demand Trends Q2 2026 (central bank purchases: 288.9 tonnes, +62% YoY).
6. Silver Institute — World Silver Survey 2026 (industrial demand ≈58% of total).
7. Federal Reserve — FOMC statement July 29, 2026 (rates unchanged).
8. Institute for Supply Management — July 2026 PMI reports.
Disclaimer: This article is provided for informational purposes only and does not constitute investment advice. Past performance does not guarantee future results. Consult a qualified financial advisor before making investment decisions.
You may also like:
- South Korea’s central bank resumed gold purchases after a 13-year pause.
- Gold and silver held gains as Hormuz diplomacy advanced, a vessel was struck, and JOLTS fell.
- Why gold was holding near $4,067 ahead of a critical jobs week that could shift rate expectations.
- Manufacturing hit a multi-year high while gold remained muted — why that mattered.
- Gold sits between a structural bull case and a policy ceiling; which will break first?
- The same macro forces that pressured gold earlier this year appear to be reversing.
- Gold ETFs saw outflows while central banks accumulated — what that divergence implies.
Popular Topics
Picked from the archive
-
01
 Topics
Bond King Jeffrey Gundlach’s Gold Signal for Investors
-
02
Topics
Federal Reserve Goes Silent: Why Gold Investors Don’t Need It
-
03
Topics
Do Gold ETFs Mean You Own Physical Gold?
-
04
Topics
Gold, Silver and Stagflation: 5 Market Signals to Watch
-
05
Topics
Silver Price Outlook May 2026: Focus on Trends, Not Numbers
-
06
Topics
How the Federal Reserve Shrunk the Dollar’s Value 97% Since 1913
-
07
Topics
BEA Removed Silver From GDP: What It Means
-
08
Topics
South Korea’s Central Bank Resumes Gold Purchases After 13 Years