How Three Government Changes Shifted Inflation’s Official Number
Key Takeaways
- The Consumer Price Index (CPI) tracks average price changes for a fixed basket of goods and services and is published monthly by the Bureau of Labor Statistics (BLS). Three major methodological changes — Owner’s Equivalent Rent (1983), adoption of a geometric mean formula (1999), and hedonic quality adjustments — each reduced the CPI’s reported rate compared with older methods.
- An independent review by the Boskin Commission (1996) concluded the CPI overstated inflation by about 1.1 percentage points per year. After several BLS revisions, a GAO review in 2000 estimated remaining bias at roughly 0.73–0.9 percentage points annually.
- The Federal Reserve targets 2% inflation using the PCE price index published by the Bureau of Economic Analysis (BEA), a different measure than CPI.
The Consumer Price Index is one of the most closely watched economic indicators. Markets react to it, central banks use it to guide policy, and government benefits such as Social Security are adjusted using CPI-based measures. But the CPI in use today has evolved from the postwar measure first introduced in 1947. Several substantive methodological changes over the decades have altered what the index captures and, in each notable case, lowered the inflation rate the CPI reports compared to older approaches.
What Is the CPI?
The Consumer Price Index for All Urban Consumers (CPI-U) measures the average change over time in prices paid by urban households for a representative basket of goods and services. The BLS publishes it monthly, and it covers roughly 93% of the U.S. population. The index groups spending into broad categories such as food, housing, apparel, transportation, medical care, recreation, education and communication, and other goods and services.
Shelter is the largest component, accounting for 35.3% of the CPI-U weight; food and beverages contribute about 13.6%. A related measure, the CPI-W, covers urban wage earners and clerical workers and is used to calculate cost-of-living adjustments for Social Security.
The Knowledge That Changes Everything

Two concise guides — one on buying gold and another on the dynamics of fiat currency — available at no cost. Sign-up functionality has been removed for privacy and security.
How Is the CPI Calculated?
The BLS compiles the CPI using a multi-step process. Price collectors record roughly 80,000 price observations each month across dozens of urban areas, building thousands of elementary indexes. Those indexes are combined into higher-level series using household expenditure weights derived from the Consumer Expenditure Survey. Since January 2023, the BLS has updated those weights annually. Choices about which items to include, how to handle substitutions between goods, and how to adjust for quality changes all influence the published inflation rate.
Why Did the CPI Calculation Method Change?
Over time the BLS has revised methods to reflect changing consumption patterns and to correct identified biases. Three changes stand out for their structural impact on the index and for the way they pushed the measured inflation rate downward relative to older methods.
How Did the 1983 Housing Shift Change the CPI?
Prior to 1983, CPI included direct measures of home purchase costs such as mortgage interest, taxes, and insurance. When mortgage rates spiked in the late 1970s, those costs fed directly into the index. In 1983 the BLS replaced direct homeownership costs with Owner’s Equivalent Rent (OER), an estimate of what a homeowner would pay to rent their own home. OER and rent together form the shelter category, which now accounts for 35.3% of CPI-U weight (OER alone is 25.9%). OER follows rental market conditions and typically lags changes in home purchase prices by a year or more, which can mute CPI’s response to sharp house-price moves.
What Was the 1999 Geometric Mean Formula Change?
Beginning in January 1999, the BLS adopted a geometric mean formula for many basic CPI components to reduce substitution bias. A geometric mean assumes consumers substitute toward relatively cheaper goods when relative prices change (for example, choosing chicken over expensive beef). Because substitution toward lower-priced alternatives typically lowers measured price growth, the geometric mean reduced the reported annual CPI by roughly 0.2 percentage points in BLS estimates.
How Do Hedonic Quality Adjustments Affect CPI?
Hedonic adjustments account for changes in product quality. When a new model of an electronic device offers significant performance improvements at the same or higher price, statistical models apportion part of the price change to improved quality rather than pure inflation. Applied widely across technology and durable goods, hedonic techniques lower measured inflation in those categories by recognizing that some price increases reflect better or different products rather than higher costs for the same good.
What Did the Boskin Commission Find?
In 1995 the Senate Finance Committee convened an advisory panel chaired by economist Michael Boskin to evaluate CPI accuracy. The commission’s 1996 report concluded the CPI overstated inflation by about 1.1 percentage points per year, identifying biases from substitution, outlet substitution, quality change, and the treatment of new products. The BLS implemented multiple reforms in response, and a Government Accountability Office review in 2000 estimated remaining bias at roughly 0.73–0.9 percentage points annually.
What Is the Difference Between CPI and PCE?
CPI is produced by the BLS; the Personal Consumption Expenditures (PCE) price index is produced by the BEA. The Federal Reserve’s 2% inflation goal is expressed in PCE terms. Key differences include the treatment and timing of expenditure weights (PCE weights are updated more frequently), the scope of consumption covered (PCE includes spending paid on behalf of households, such as employer-provided healthcare), and formulaic differences that typically leave PCE a few tenths of a percentage point below CPI in annual readings.
These structural contrasts matter because policymakers and markets often focus on different gauges, and headline comparisons between CPI and PCE can show meaningful divergence at times.
What Does CPI Have to Do With Gold?
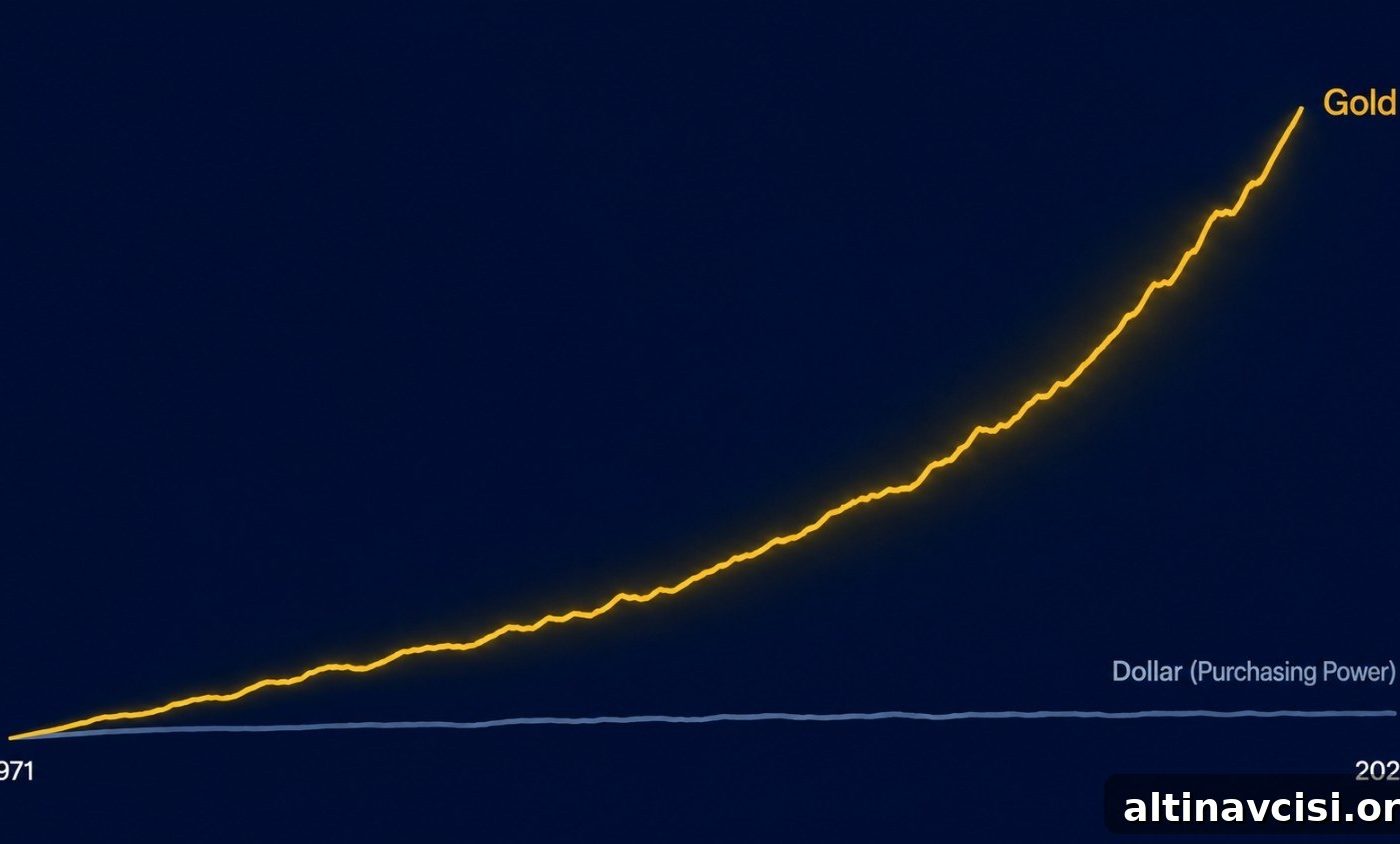
Gold is often discussed as an inflation hedge, but its price is influenced by several factors beyond headline CPI. Research cited by the World Gold Council finds that CPI changes alone explain a modest share of gold’s historical price movements. Gold reacts strongly to real yields — the inflation-adjusted return on government bonds — because negative or low real yields reduce the opportunity cost of holding a non-yielding asset. Over long horizons, gold has significantly outpaced CPI-measured inflation, reflecting both currency depreciation and long-run demand dynamics.
The methodological changes described earlier—OER for shelter, substitution-aware formulas, and hedonic adjustments—tend to lower measured inflation. Lower reported inflation raises calculated real yields for a given nominal yield, which in turn can influence gold’s attractiveness. Investors who recognize that the CPI is an evolving statistical construct interpret inflation reports with that context in mind.
Stay On Top of Gold & Silver Prices
Get important market alerts sent straight to your inbox. Live widgets and embedded scripts have been removed for security.
People Also Ask
What exactly does the Consumer Price Index measure?
The CPI measures the average change over time in prices that urban consumers pay for goods and services in a representative basket. It is a measure of price change and relies on expenditure weights to reflect household spending patterns.
How is CPI different from PCE?
CPI is reported by the BLS; PCE is reported by the BEA. PCE covers a broader set of expenditures (including those paid on behalf of households) and updates its weights more frequently. The Fed’s 2% inflation target uses PCE, and PCE readings are typically a few tenths of a point below CPI.
What did the Boskin Commission conclude?
The Boskin Commission concluded in 1996 that CPI likely overstated inflation by about 1.1 percentage points per year and recommended methodological changes. Subsequent BLS reforms and GAO review reduced the estimated remaining bias but did not eliminate it entirely.
How does CPI relate to gold prices?
Changes in CPI explain only a portion of gold’s price movements. Gold is driven mainly by real yields and long-term currency trends; when real yields fall, gold tends to perform better. Historical comparisons show gold has outpaced CPI inflation over multiple decades.
What is “core CPI”?
Core CPI excludes food and energy because those categories are more volatile and can obscure underlying inflation trends. Policymakers often look at core measures to assess persistent price pressures, though the Federal Reserve prefers core PCE for policy guidance.
SOURCES
Bureau of Labor Statistics (CPI); BLS Monthly Labor Review (geometric mean change); Boskin Commission Final Report (1996); U.S. Government Accountability Office review (2000); BLS analysis of Owner’s Equivalent Rent; Bureau of Economic Analysis (PCE); Federal Reserve statements on longer-run goals; BLS materials on hedonic price adjustments; World Gold Council research; LBMA gold price historical data; BLS CPI-U expenditure tables; Federal Register notice on updating spending weights.
Disclaimer: This article is informational and not financial or investment advice. Consult a qualified financial professional before making investment decisions.
You May Also Like:
- M2 Money Supply: The Number That Makes Your Portfolio Meaningless
- The Gold IRA Rollover Trap Most Investors Walk Straight Into
- The Canadian Gold Maple Leaf: Purer Than the Eagle, Lower Premium, and IRA-Eligible
- The Federal Reserve Has Eroded 97% of Your Dollar’s Value Since 1913. Here’s the Mechanism.
- Class 3 Vault: The Two-Hour Attack Standard That Protects Your Gold
- American Gold Eagle Coin: The Complete Investor Guide
- The Petrodollar System Explained: What It Is, How It Worked, and What’s Replacing It
Popular Topics
Picked from the archive
-
01
 Topics
Central Banks Favor Gold Over the Dollar: Impact on Your Savings
-
02
Topics
Record Gold ETF Outflow Sparks Debate as China Disagrees
-
03
Topics
Is Gold Still a Safe Haven in War? Investor Insights
-
04
Topics
Gold Near $4,330 as 70% Rate-Hike Odds Rise, China Intervenes
-
05
Topics
Jobs Beat, Ceasefire, Deficit: Impact on Gold Prices
-
06
Topics
Silver Price Spikes to $69.85, FOMC Erases Gains
-
07
Topics
Banks Forecast Gold Over $5,400 After Greenland News
-
08
Topics
Why Gold Climbed After an 8% Oil Spike — What’s Different