Why Silver Price Jumped Nearly 5% Today
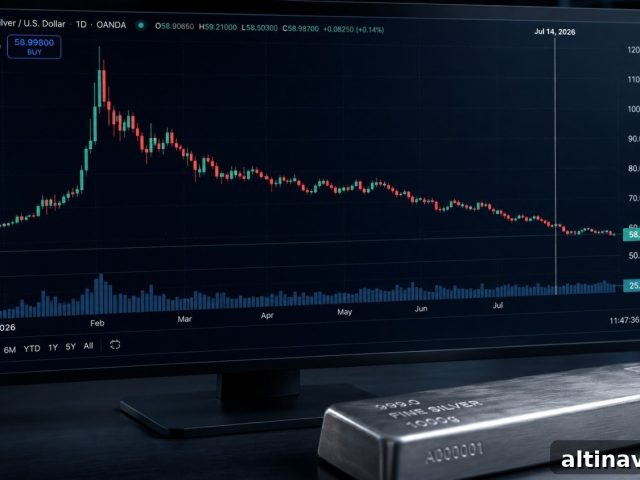
As of Tuesday, July 21, 2026, silver was trading near $58.92 per ounce, up roughly 4.5% from Monday’s close of $56.40. Gold rose about 1.2% to $4,054 per ounce. Silver has outpaced gold by more than three-to-one in this move. The immediate catalyst was a 10-day ceasefire proposal reportedly received by Iran from mediators and the sequence of market reactions that followed.
Why Is Silver Up Nearly 5% Today?
A senior Iranian official confirmed to reporters that Tehran received a mediators’ proposal for a 10-day ceasefire, marking the first clear diplomatic development since early July. That news set off a familiar chain of reactions in commodity and rate markets, and this time the chain moved in the direction that favors precious metals—especially silver.
The market sequence that pushed silver higher is straightforward:
- The ceasefire proposal lowered the immediate risk of escalating conflict in the region.
- Oil prices eased from recent one-month highs as fears of supply disruption faded.
- With oil softer, near-term inflation expectations moderated because energy is the fastest-moving component in many inflation gauges.
- Traders reduced the probability of an interest-rate increase in September; earlier in the day markets had placed roughly a two-thirds chance on a September hike.
- As rate-hike odds fell, real yields declined, cutting the opportunity cost of holding non-yielding physical silver.
- Silver rallied — and it typically appreciates faster than gold in these environments because it benefits from both monetary and industrial demand drivers.
This last point is critical. About 58% of annual silver demand is industrial, covering uses such as solar panels, semiconductors, electric vehicles, and data-center components. That dual demand profile means silver responds both to shifts in monetary sentiment and to improvements in industrial outlook. When inflation and rate-hike fears ease, silver can rally on both fronts; gold, by contrast, moves primarily as a monetary hedge.
The Edge Every Investor Needs
Smarter precious metals investing starts here. The Nuggets Newsletter delivers timely market insights, Fed updates, global trends, and educational material to help you stay informed.
What Does the Gold-Silver Ratio Tell Us Right Now?
The gold-silver ratio expresses how many ounces of silver are required to purchase one ounce of gold. A declining ratio indicates silver is gaining ground relative to gold.
On July 21 the ratio stood near 68.8:1, down from about 70:1 earlier in the month. The move from 70 to 68.8 in a short period is notable because it reflects traders trimming the inflation risk premium that had pressured silver since hostilities in the Middle East intensified earlier in the year. While the ratio remains elevated relative to its long-term average (the 50-year mean is closer to 65:1), the recent compression suggests silver can outperform gold during sustained rallies.
Short-covering also accentuated the move: traders who had built bearish positions during the prior decline were forced to buy back positions as momentum shifted, adding extra upward pressure on silver in the short term.
What Happens Next for Silver Prices?
The Federal Reserve was scheduled to meet on July 28–29. The market widely expected the Fed to hold rates steady at that meeting, assigning a high probability to no change. The bigger question is September: the June FOMC projections showed a split among officials, with roughly half signaling the possibility of at least one hike later in the year.
September’s path depends heavily on oil. If this ceasefire holds and oil remains subdued, inflation expectations can stay anchored and the case for a September hike weakens—favorable for silver. If diplomatic progress collapses and oil spikes again, inflation fears could re-emerge and raise rate-hike odds, creating headwinds for silver.
Traders are not treating today’s rally as a guarantee of a sustained trend. Instead, they are reweighting probabilities along a binary possible path for geopolitics and energy. Because silver responds to both monetary conditions and industrial demand, those probability shifts tend to move silver more sharply than gold.
Does Today’s Move Change the Long-Term Case for Silver?
No fundamental shift occurred in the supply-demand backdrop from a single trading session. The broader silver market remained structurally tight in 2026, with continued annual supply deficits and significant cumulative draws on above-ground inventories over recent years. Those structural dynamics underpin the long-term case for silver as both an industrial metal and a store of value.
What today’s session does highlight is the specific mechanism that has restrained silver through periods of elevated geopolitical risk: oil-driven inflation expectations can keep rate-hike fears elevated, which raises the opportunity cost of holding non-yielding metals. When those expectations ease—even temporarily—silver can reprice quickly due to its dual demand profile. For long-term investors, that responsiveness is part of silver’s appeal, not its risk.
Live gold and silver price charts and historical data are widely available from reputable market data providers and precious-metals dealers for those who want real-time updates.
Stay On Top of Gold & Silver Prices
Receive important market alerts directly to your inbox.
SOURCES
1. FXStreet — Silver price reported on July 21, 2026 (silver +4.54% to roughly $58.96).
2. Reuters reporting on July 21, 2026 — coverage of gold gains and diplomacy developments.
3. CNBC — coverage of market reaction to diplomatic news and oil movement, July 21, 2026.
4. FX Leaders — analysis on silver price dynamics and short-covering, July 21, 2026.
5. GoldSilver — commentary on the gold-silver ratio and July 15, 2026 developments.
6. Silver Institute — World Silver Survey 2026 (supply/demand and inventory data).
7. Federal Reserve — FOMC Summary of Economic Projections, June 17, 2026.
8. GoldSilver — live price charts and spot-price data referenced for figures above.
Disclaimer: This article is informational only and does not constitute financial or investment advice. Consult a qualified financial adviser before making investment decisions.
You May Also Like:
- China Ends Paper Gold Trading July 24. For Physical Holders, That’s a Confirmation.
- Silver Is Up 1.5% Today. Oil Is Up 3%. Those Two Moves Shouldn’t Coexist. Here’s Why They Do.
- Hong Kong Just Ran Its First Gold Settlement. The Banks Who Did It Also Run London’s.
- Consumer Inflation Expectations Just Fell to 4.2%. Gold Fell Too. The Survey Missed the Oil Spike.
- Gold Fell 3.4% This Week. The Long-Term Case Didn’t.
- Manufacturing Just Had Its Best Month of 2026. Gold Just Had One of Its Worst Days.
Popular Topics
Picked from the archive
-
01
 Topics
Gold Price Showdown: Will It Hit $5,000 or Drop to $3,500?
-
02
Topics
Wall Street’s $6,000 Gold Call Relies on Hidden Data
-
03
Topics
July 2026 Silver Outlook: Two Catalysts Set to Move Prices
-
04
Topics
Gold Prices Up 21%, Silver 25% YTD Amid AI and Inflation Fears
-
05
Topics
Gold Price Outlook June 2026: CPI Impact and Fed Signals
-
06
Topics
WGC Q1 2026: Asian Insights Wall Street Overlooks
-
07
Topics
Silver Jewelry vs Silver Bullion: A Buyer’s Guide
-
08
Topics
Why OCBC Cut Its Gold Forecast by $740