Why Gold Prices Stall While Oil Jumps 9%: Market Drivers
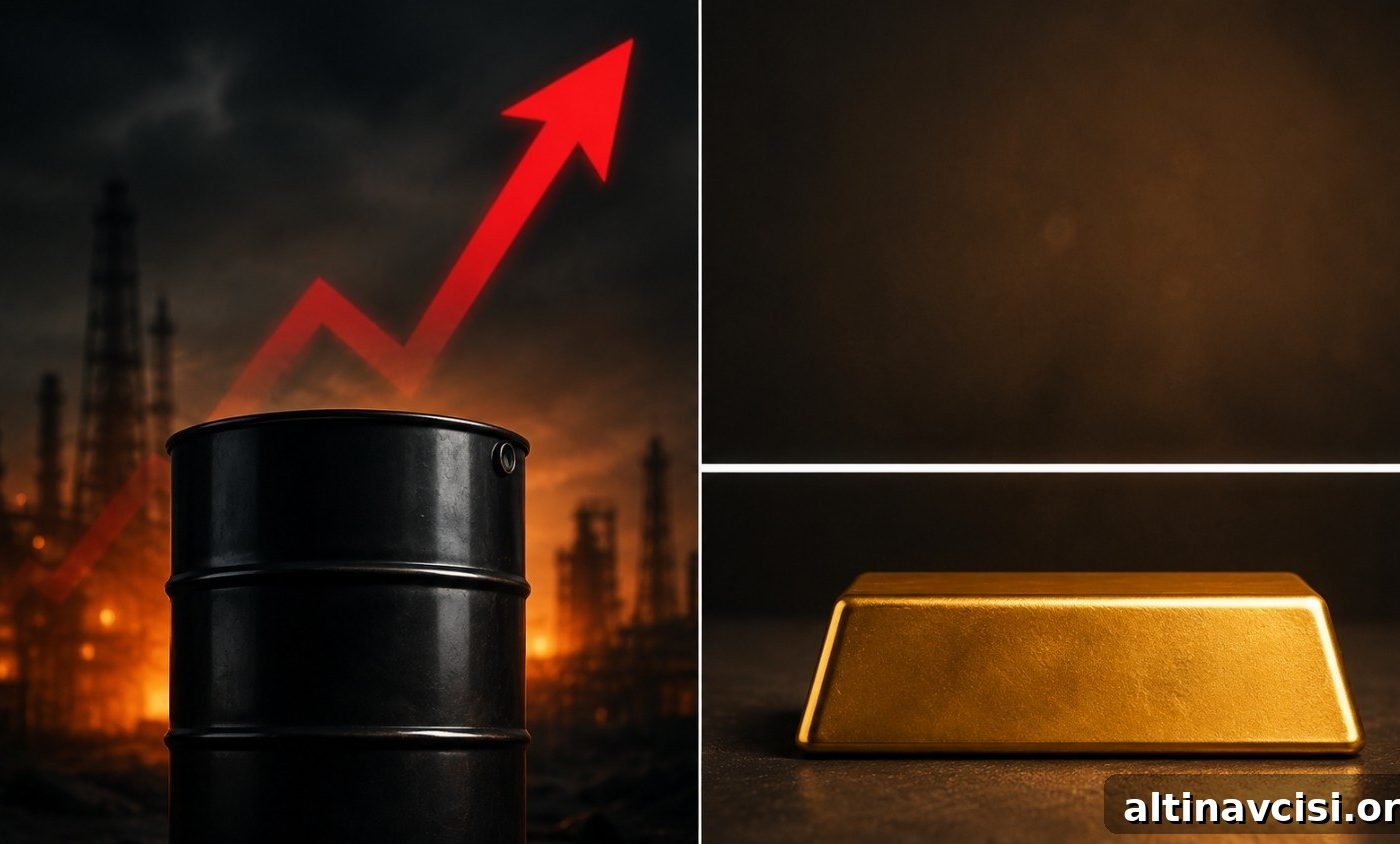
Oil has jumped more than 9% over five trading days. The Strait of Hormuz is effectively restricted, with vessel transits down roughly 52% week‑on‑week, and U.S. airstrikes on Iran have entered a fourth consecutive day. By the simple logic that gold is an “inflation hedge,” one might expect gold to be surging right now.
Instead, gold is trading near $4,052 — essentially unchanged on the day and down roughly 8% over the past 30 days.
That disconnect is not a market failure. It’s the market functioning as designed and it reveals something important about what gold actually protects against.
Source: goldsilver.com/price-charts — 30-day gold spot price (Jun 15 – Jul 15, 2026)
Why Is Oil Rising While Gold Stays Flat?
Both oil and gold are often called “inflation hedges,” but they react to very different kinds of inflation. Oil responds to immediate, physical supply disruptions. When tankers cannot transit the Strait of Hormuz, barrels cannot reach buyers. That scarcity pushes oil prices higher because the commodity is literally harder to obtain. This is supply‑chain inflation: real, location‑specific, and closely tied to geopolitics and military risk.
Gold, by contrast, reacts primarily to monetary conditions — the erosion of currency value over time through sustained deficit spending, money creation, and loose monetary policy. A short‑term supply shock that does not expand the money supply does not directly trigger the monetary pressures that typically drive gold higher.
Put simply: a spike in oil from a shipping or geopolitical bottleneck is not the same as the slow, cumulative debasement of a currency. Markets price those two forces differently.
The Edge Every Investor Needs
Smarter precious metals investing starts here. The Nuggets Newsletter delivers market insights, Fed updates, global trends, educational videos, and timely alerts.
How Does an Oil Spike Hurt Gold Prices?
A rise in energy prices feeds into headline inflation measurements. If consumer price data shows higher inflation, the Federal Reserve faces pressure to tighten policy by raising interest rates. When the market prices in higher expected rates, real yields (interest rates adjusted for inflation) tend to rise. Higher real yields increase the opportunity cost of holding a non‑yielding asset like gold, prompting institutional investors to trim gold allocations.
That sequence — supply shock → higher oil → upward pressure on CPI → stronger rate‑hike expectations → higher real yields → selling pressure on gold — is the exact mechanism influencing markets today. For example, soft month‑to‑month CPI prints can be offset by sharp energy moves, and futures-based tools show elevated odds of additional rate action when commodity prices jump.
So while oil climbs, gold can be pressured in the short term because the immediate policy response to energy‑driven inflation is higher rates, not looser money.
What Does the Gold-Oil Divergence Actually Mean for Long-Term Holders?
Here is a point many headlines miss: the very mechanism that pushes gold down in the short term during an oil shock is often the same mechanism that later sends gold much higher.
The Federal Reserve can and will raise rates to combat oil‑driven inflation, but it cannot raise indefinitely without creating mounting fiscal strain. U.S. national debt has climbed to historically large levels, and annual interest obligations exceed a trillion dollars; every additional quarter‑point in average rates adds tens of billions to federal borrowing costs. At some point, rising borrowing costs and political and economic constraints force a policy shift. When that happens, real yields fall and the monetary debasement trade reasserts itself — a pattern that has repeated after major tightening cycles for decades.
Long‑term, physical holders of gold are not focused on next month’s CPI print. Many are positioned for the broader cycle: tightening that becomes unsustainable, followed by easing, renewed currency weakness, and a subsequent move higher in precious metals. An oil‑driven repricing can create near‑term paper losses for gold holdings, but it does not erase the structural reasons investors bought gold in the first place.
Where Do Gold and Silver Stand Right Now?
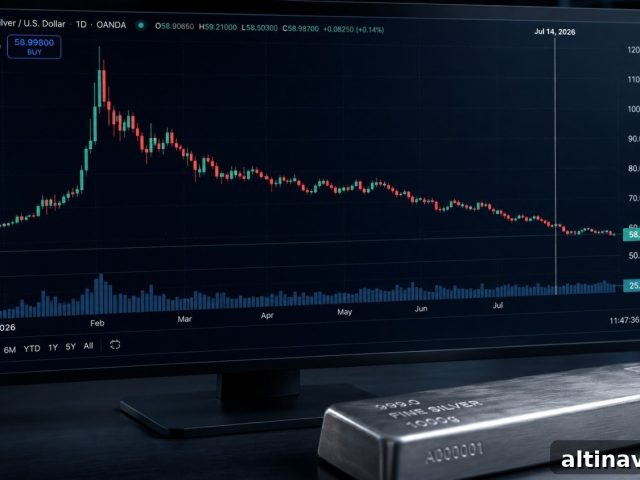
At the time of writing, gold trades around $4,052 — roughly 28% below its January intraday record of $5,589. Silver sits near $58.29, a decline of more than 52% from its peak of $121.62. Both metals have pulled back from earlier highs, but the underlying structural narratives remain intact.
Supply and demand dynamics still favor precious metals: central banks continue to buy gold, and silver has experienced multi‑year supply deficits. According to industry reports, silver ran a confirmed supply deficit for five consecutive years through 2025 and was on track for a sixth consecutive shortfall in 2026, with a sizable cumulative imbalance. The gold‑to‑silver ratio remains elevated at roughly 69:1, indicating that silver is cheaper relative to gold versus its long‑term average.
The Strait of Hormuz escalation is a clear short‑term disruption to energy markets. It can influence price measures and monetary expectations, but it does not overturn the fiscal and monetary trends that underpin precious metals over longer horizons. A flat trading day for gold in the midst of an oil spike is not evidence that gold has failed — it is a sign that gold is responding to the monetary signals that matter most for its role as a long‑term store of value.
SOURCES
1. U.S. Bureau of Labor Statistics — Consumer Price Index, June 2026 (CPI release)
2. GoldSilver — Live gold and silver price charts (30‑day gold spot price, June–July 2026)
3. CME Group — FedWatch Tool (rate‑hike probability measures)
4. Kpler/CNBC reporting — Strait of Hormuz vessel transit data (July 2026 week)
5. Silver Institute / World Silver Survey 2026 (Metals Focus)
6. U.S. Treasury Fiscal Data — Debt to the Penny (debt and interest cost statistics)
Disclaimer: This article is for informational purposes only and does not constitute financial or investment advice. Always consult a qualified financial adviser before making investment decisions.
You May Also Like:
- Gold and Fed Policy: When the System Picks Winners
- Warsh Testified. Gold Jumped $90. The Signal Everybody Missed Was in His Report.
- Gold Jumped $90 This Morning. June CPI Just Explained Why.
- Silver Fell 3.8% Today. Gold Fell 2.9%. The Gap Has a Name.
- Trump’s Hormuz Toll Is an Inflation Tax. Here’s Why Gold Fell.
- Gold Fell 1.4% on an Iran Strike. One Number Tomorrow Morning Could Change Everything.
Popular Topics
Picked from the archive
-
01
 Topics
Gold Price Showdown: Will It Hit $5,000 or Drop to $3,500?
-
02
Topics
Wall Street’s $6,000 Gold Call Relies on Hidden Data
-
03
Topics
July 2026 Silver Outlook: Two Catalysts Set to Move Prices
-
04
Topics
Gold Prices Up 21%, Silver 25% YTD Amid AI and Inflation Fears
-
05
Topics
Gold Price Outlook June 2026: CPI Impact and Fed Signals
-
06
Topics
WGC Q1 2026: Asian Insights Wall Street Overlooks
-
07
Topics
Silver Jewelry vs Silver Bullion: A Buyer’s Guide
-
08
Topics
Why OCBC Cut Its Gold Forecast by $740