Hawkish Fed: Gold Below $4,000, Silver Below $60, Market Pushback
In today’s update: Gold has dipped below $4,000 for the first time since November 2025 and silver fell under $60 for the first time since December 2025. Yet while the Fed reprices higher and the U.S. dollar strengthens, China recorded its largest monthly gold imports in over two years, gold ETFs ended a four-week outflow streak with strong inflows, and major banks still point to $4,600–$5,100 gold targets by year-end.
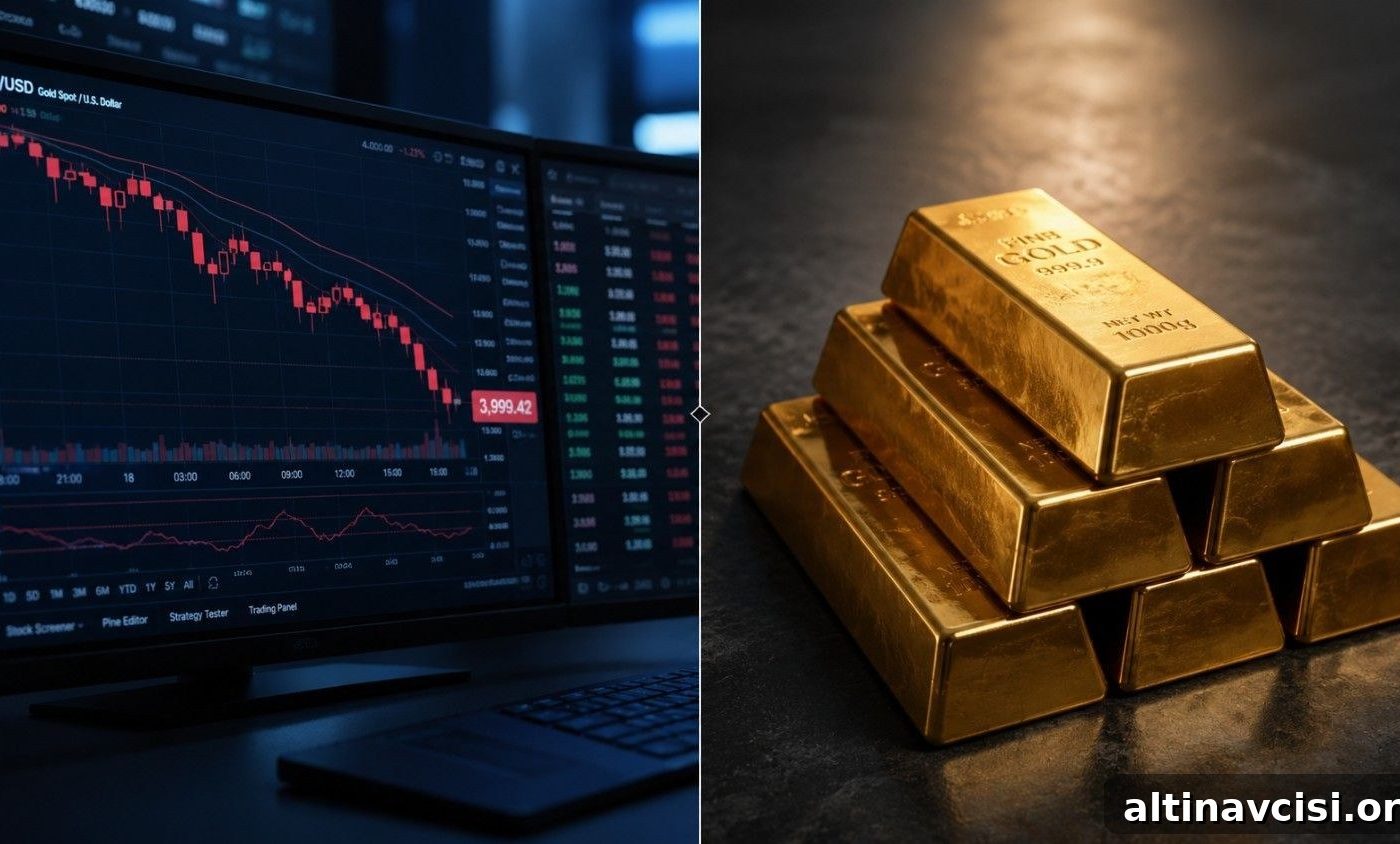
On June 24 gold slid below $4,000 — the first time it has traded under that mark since November 2025 — and lost more than $120 in a single session. Silver suffered an even sharper move, dropping over 5% and falling below $60. The immediate cause was shifting Fed expectations: CME FedWatch now prices roughly a 70% chance of a September rate hike, up sharply from a week earlier. Fed officials have taken a more hawkish tone, pushing the dollar to a 13-month high. Because precious metals do not yield interest, they typically react negatively when monetary policy tightens and the dollar strengthens. That dynamic explains much of the recent paper-market selling pressure.
Why Did Gold and Silver Sell Off This Week?
The sell-off was driven mainly by rising odds of further Fed tightening and a stronger U.S. dollar. As rate-hike expectations rose, short-term real yields moved higher, reducing the opportunity cost of holding cash and government bonds relative to non-yielding assets like gold and silver. Several large banks adjusted their near-term forecasts lower — ING, for example, trimmed its third- and fourth-quarter targets — reflecting the same mechanism: tighter monetary expectations, a firmer dollar, and a temporary pullback in metal prices. Historically, these sell-offs in the paper market have been cyclical pauses rather than structural breakdowns, and the resolution usually follows the same path: weaker dollar, stabilizing yields, and renewed physical demand.
The Edge Every Investor Needs
Subscribe for concise, timely insights on precious metals markets, Fed developments, and global demand trends.
Sign up on our site to receive market alerts and commentary by email. (Subscription form removed for privacy.)
What Does Investor Panic Historically Signal for Gold?
Sentiment gauges show only about 25% of Americans think now is a good time to invest, the lowest since mid-2022, according to a recent survey. Many cite recession fears and market volatility as reasons to favor bonds and cash. While broad retail retreat can look alarming, history shows that widespread investor panic often appears in the later stages of corrections rather than at the start of new multi-year downtrends. Investors who buy and hold physical gold typically do so for strategic reasons — as a portfolio diversifier or hedge — and they do not require bullish market sentiment to justify ownership. In volatile moments, gold’s role as an insurance asset becomes clearer rather than less important.
Are Gold ETF Investors Starting to Come Back?
Physical gold-backed ETFs registered about $1.1 billion of inflows last week, equal to roughly 5.1 tonnes — the strongest weekly inflow since mid-April and a reversal of four consecutive weeks of outflows that removed around $7.6 billion from funds. Total ETF holdings remain above 4,000 tonnes, and cumulative inflows for the year still show a positive trend. Institutional ETF demand from Western investors is one of the core pillars supporting the market, alongside central bank purchases and Asian physical demand. When institutions buy into a selloff, it often signals perceived value rather than fear. Upcoming U.S. inflation data will influence whether this renewed ETF demand continues.
Why Is China Still Buying Gold While the Price Falls?
China imported about 163 tonnes of gold in May 2026, the largest monthly figure since March 2024, according to customs data. Imports for the first five months of 2026 came to approximately 692 tonnes, a year-over-year rise of roughly 76%. Demand is driven by physical bullion bars and accumulation products. The central bank’s official buying streak continued into its 19th consecutive month in May, with a near-10-tonne addition — the largest single-month increase since December 2024. Chinese buyers appear to be accumulating strategically at prices well below January’s highs. This steady, deliberate buying points to a meaningful structural floor in physical demand for gold across Asia.
Standard Chartered Sees Gold at $5,100 by Mid‑2027 — Even in Its Base Case
Standard Chartered’s mid‑2026 outlook forecasts gold at about $5,100 per ounce by mid‑2027. The bank cites three pillars for that call: ongoing central bank purchases, persistent fiscal deficits, and a rebound in Western investor demand as real yields stabilize. Other large institutions also still point to significant upside: Goldman Sachs, Deutsche Bank, and ING have all published multi‑quarter targets in the $4,600–$4,900 range. Those forecasts imply meaningful gains from current levels near $3,976. Short-term volatility is expected, but many long-term forecasts converge on the same direction — higher prices over the next 12–18 months.
Stay On Top of Gold & Silver Prices
Receive concise market alerts and expert commentary directly to your inbox.
To receive updates, subscribe on the site. (Form removed from this article.)
SOURCES
Bloomberg; ING Think; CNBC; CME Group FedWatch Tool; World Gold Council; Allianz Life Quarterly Market Perceptions Study; Trading and research reports referenced by major banks; industry trade publications.
Disclaimer: This article is for informational purposes only and does not constitute financial or investment advice. Consult a qualified financial adviser before making investment decisions.
You May Also Like:
- Gold Just Broke $4,000. The Mainstream Called the Debasement Trade Dead. They’re Wrong.
- Two Things Are Hitting Gold Simultaneously. Only One Is About Gold.
- Why Is Silver Down 5%? The Gold–Silver Ratio Explains.
- BofA: Three Rate Hikes Priced In — What That Means for Silver.
- Iran Deal, Falling Oil, and a Precious Metal Outlier: Why Gold Still Holds Above $4,100.
- PCE and Precious Metals: How Thursday’s Inflation Print Could Move the Market.
- Gold Targets from Major Banks: What the $1,400 Gap Means.
Popular Topics
Picked from the archive
-
01
 Topics
Gold Gains as Inflation Boosts Fed Rate-Cut Expectations
-
02
Topics
Gold Price Up 1.5% as ADP, ISM and Beige Book Weigh on Fed
-
03
Topics
Gold Targets Are Falling, but the $8,000 Forecast Holds
-
04
Topics
AI Bubble Fears Surge as Gold Price Falls Below 4,000 USD
-
05
Topics
Silver Price Near $80 as Iran Ceasefire Revives Rate-Cut Hopes
-
06
Topics
Why 72% of Family Offices Don’t Hold Gold: What They’re Missing
-
07
Topics
Gold Up 3% and Silver 7% as Metals Rally to End Q1
-
08
Topics
Invest in Precious Metals in 2026: Why Allocations Are Rising