Gold Hits $4,000: Why the Debasement Trade Isn’t Dead
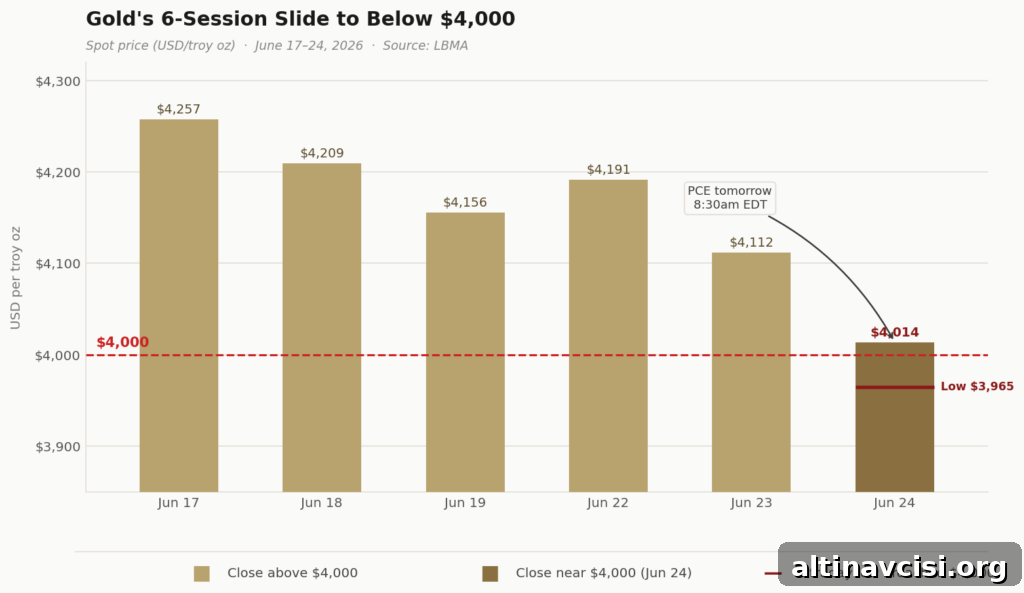
Gold slipped below $4,000 per ounce today for the first time since November, prompting some financial outlets to declare the end of the so-called “debasement trade.” The argument is straightforward: the Federal Reserve signaled possible additional rate hikes, real Treasury yields turned positive, the U.S. dollar strengthened to a 52-week high, and gold has fallen roughly 28% from its January peak. That explanation captures the short-term price action, but it doesn’t tell the whole story.
The selloff is real and the price dynamics are textbook. Yet the deeper structural forces that pushed gold from roughly $2,600 to nearly $5,590 over the past year remain intact. Understanding the distinction between near-term market mechanics and the longer-term structural thesis is essential heading into tomorrow’s economic data.
Why is gold falling today?
The immediate explanation is straightforward. At the Federal Reserve’s June 17 meeting — Chair Kevin Warsh’s first — nine of nineteen FOMC participants projected at least one additional rate hike before year-end. The median projection in the dot plot moved higher, and markets quickly repriced the odds. Tools that track fed-funds expectations began showing a significant probability of at least one 25-basis-point hike by December, and the U.S. Dollar Index rose above 100 for the first time since May 2025.
More important for bullion: real yields on 10-year Treasury Inflation-Protected Securities have climbed near 2.2% (per Federal Reserve TIPS data). When real yields rise, they become a meaningful alternative return for conservative investors, and that creates a headwind for an asset like gold that produces no yield. Paper-market selling followed logically from that repricing.
Gold also took on selling pressure amid a broader technology-stock and equity decline. Margin calls and algorithmic risk reduction forced some investors to liquidate positions across risk assets, including bullion. That type of selling aggravates short-term moves but does not constitute a fundamental repudiation of gold’s long-term role as a store of value.
Did the structural case for gold change today?
No. That is the essential distinction.
None of the structural drivers that supported the rally into 2024 and 2025 were reversed by today’s rate-signal. The U.S. fiscal deficit did not disappear overnight; Congress did not suddenly balance the budget; and the Fed did not adopt the kind of disinflationary, Volcker-era policy path that would permanently undermine the argument for holding non-yielding real assets. A single potential 25-basis-point hike — if implemented — would lift the federal funds rate to roughly the mid-to-upper 3% range, still well below inflation gauges running near or above that level.
Put simply, a Fed that can signal hikes but risks damaging the housing market and Treasury market by pushing too far is managing a constrained environment rather than solving the larger issue of monetary debasement. Historically, those constrained periods tend to reward long-term holders of physical precious metals.
What does tomorrow’s PCE inflation data mean for gold?
May Personal Consumption Expenditures (PCE) inflation data will be released Thursday at 8:30am EDT. Consensus expects headline PCE at around 4.1% year-over-year. If the print comes in hotter than expected, markets may extend tighter rate expectations and gold could face further near-term pressure.
However, it’s important to remember that May’s PCE reflects a period when energy prices were elevated because of geopolitical tensions earlier in the spring. With diplomatic developments since mid-June easing some of those tensions, energy prices have already retreated. Several major banks and economists have suggested June’s PCE — published in late July — is more likely to show meaningful cooling. In that sense, tomorrow’s number is backward-looking and may overstate near-term inflation persistence relative to the direction of prices going forward.
Markets will interpret the print as a possible guide to policy; long-term physical metal holders should interpret it as part of a broader, evolving inflation trajectory rather than a definitive turning point.
Is the debasement trade really over?
The numbers are stark: gold has fallen roughly 28% from its late-January high near $5,590, and silver has retraced more than 50% from its highs around $120. Those declines are painful for holders who entered near the peak and underline the volatility of precious metals markets.
But the underlying arguments remain. The United States continues to run sizable fiscal deficits measured in trillions of dollars. Real wages are still under pressure when compared with official inflation measures. The Fed’s preferred price gauge remains materially above the long-term 2% target. And the structural concern that motivated record central bank purchases of gold in 2024 and 2025 — a gradual erosion of confidence in dollar-denominated reserves and the potential for higher inflation over time — has not been resolved by a single adjustment in Fed projections.
Mainstream sentiment often exits after a large correction; that is a recurring pattern in markets. A 28% pullback has shifted many investors’ risk tolerance and outlook. But that does not necessarily indicate the end of the long-term “debasement trade.” For investors focused on preserving purchasing power over multi-year horizons, the recent drawdown may present an opportunity rather than a final signal of long-term decline.
SOURCES
1. CME Group — FedWatch Tool: FOMC rate-change probabilities
2. Federal Reserve Bank of St. Louis (FRED) — 10-Year Treasury Inflation-Indexed Security (TIPS)
3. Federal Reserve — H.15 Selected Interest Rates
4. Federal Reserve — FOMC Summary of Economic Projections, June 17, 2026
5. Morningstar — coverage and expectations for May PCE inflation
6. LBMA — precious metal prices and market data
Disclaimer: This article is for informational purposes only and does not constitute financial or investment advice. Always consult a qualified financial adviser before making investment decisions.
You May Also Like:
- Two Things Are Hitting Gold Simultaneously. Only One Is About Gold.
- Why Is Silver Down 5%? The Gold–Silver Ratio Explains.
- BofA Says Three Rate Hikes. Silver Already Priced In the First Move.
- Iran Deal, Falling Oil, and Why Gold Remains Above $4,100.
- PCE Data Drops Thursday: What It Means for Precious Metals.
- Gold Targets Revisited: Divergence Among Major Banks.
- What Recent Trading Around Juneteenth Tells Investors.
- Half the Fed Signals a Hike While Many Central Banks Keep Buying Gold.
Popular Topics
Picked from the archive
-
01
 Topics
Why Silver Dropped 3.3% vs Gold’s 1.6%: The Gap Explained
-
02
Topics
Banks Forecast Gold Over $5,400 After Greenland News
-
03
Topics
How Much Gold Does It Take to Buy a House?
-
04
Topics
How to Buy Gold in 2026: A Step-by-Step Guide for New Investors
-
05
Topics
Gold’s Center of Gravity Shifted East: 5 Stories That Prove It
-
06
Topics
1 Trillion Added to Debt: How It Could Move Gold Prices
-
07
Topics
Silver Jewelry vs Silver Bullion: A Buyer’s Guide
-
08
Topics
Fed Study: 5 Countries Cashed In on Gold Reserves in 30 Years