298 Tonnes of ETF Gold Are Underwater, Central Banks Are Not
Gold ETF outflows accelerated in 2026 after the rate-cut narrative that pushed gold to $5,595 in January reversed. The Federal Reserve shifted to a hawkish stance as oil-price pressures tied to the Iran conflict renewed inflation concerns. Standard Chartered analyst Suki Cooper estimates that roughly 298 tonnes of gold held inside ETFs is now underwater — a sizable structural cap on any near-term rally.
As of Thursday, June 25, 2026, gold traded near $4,009 an ounce, recovering somewhat after a midweek break below $4,000 — the first time under that level since November 2025. Silver sat around $58.03. Both metals have given back about 29% from their January highs as changing Fed expectations under Chair Kevin Warsh reshaped the market. The U.S. dollar reached a 13-month high, and CME FedWatch showed roughly a 68% chance of a September rate hike, up sharply from 29% a week earlier.
The paper market tells a clear story: ETF investors bought into the rate-cut thesis, and when that thesis evaporated they started exiting positions. But beneath that volatile paper market sits a very different, steadier group of buyers that has not budged.
What’s happening in the ETF market right now?
Gold-backed exchange-traded funds recorded net outflows of about 16 metric tonnes in May 2026 and continued bleeding into early June. Last week, flows briefly reversed: a $1.1 billion inflow snapped four straight weeks of redemptions, according to World Gold Council ETF flow data published in June 2026. That inflow provides a welcome breath of support, but the overhang remains significant.
In a June 24 research note, Standard Chartered’s Suki Cooper highlighted that roughly 298 tonnes of gold within ETFs are held at a loss at prices near $4,000, up from 270 tonnes when gold traded above $4,250. These are not long-term strategic holders; many are traders with stop-losses or re-entry targets. Every dollar of price recovery toward their entry points creates potential selling pressure, which forms a structural ceiling on any near-term rally rather than a permanent floor.
That overhang matters because ETF redemptions translate into actual metal supply. When investors redeem ETF shares, authorized participants can return physical gold to the market. A prolonged wave of redemptions therefore becomes a supply event, not just a shift in paper exposure. Standard Chartered’s 298-tonne figure corresponds to roughly $38 billion of metal at current prices held by investors inclined to sell rather than hold.
Who is buying on the other side?
Here the two markets diverge. The World Gold Council’s 2026 Central Bank Gold Reserves Survey (published June 16) found that 89% of reserve managers expect global central bank gold holdings to rise over the next 12 months. A record 45% of the 76 central banks surveyed plan to add to reserves — up from 43% in 2025 — marking the broadest participation in the survey’s nine-year history.
Crucially, central banks are not rate-sensitive traders. They generally have fixed allocation targets and multi-year mandates rather than quarterly rebalancing horizons. That creates a clear buying incentive when prices fall: each ounce costs less and helps move an institution closer to its strategic allocation. In short, ETF traders and sovereign reserve managers play different games measured over different time frames.
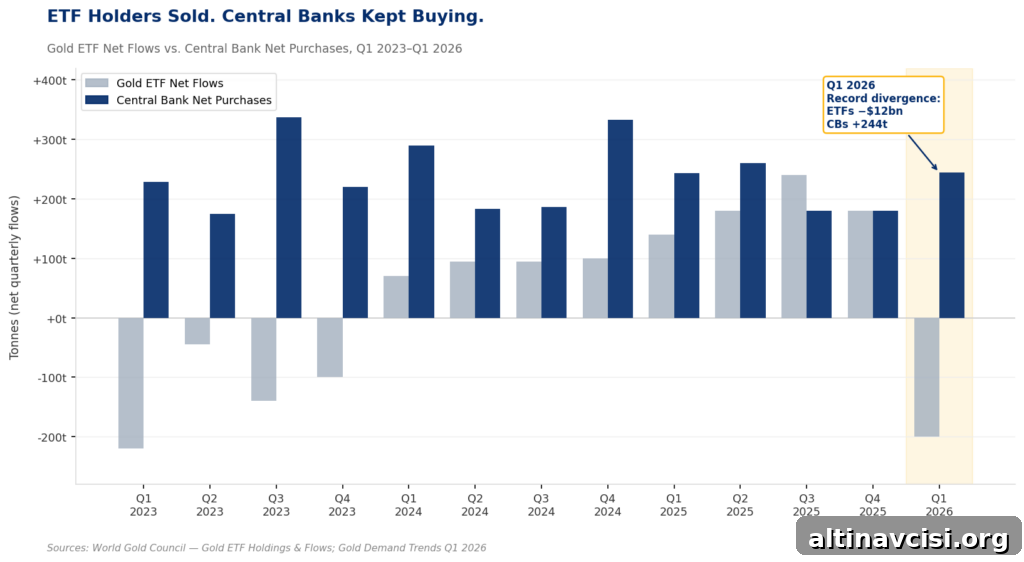
World Gold Council data show central banks bought a net 244 tonnes of gold in Q1 2026 — above the prior quarter and the five-year average. Poland added 14 tonnes in April alone, bringing its year-to-date total to 45 tonnes. The People’s Bank of China extended an 18-month buying streak, and the Czech National Bank added 2 tonnes. That buying continued even while gold traded about 28% below the January peak of $5,595 per ounce.

The Edge Every Investor Needs
Smarter precious-metal investing starts here. The Nuggets Newsletter delivers market insights, Fed updates, global trends, educational videos, and actionable analysis.
What does the ETF–central bank divergence mean for gold’s price?
On the surface, ETF outflows look plainly bearish — and that interpretation is technically correct. But it is incomplete without considering who sets the marginal price of gold. Through 2025, Western ETF buyers dominated flows. Their purchasing, fueled by expectations of Fed rate cuts, drove gold from $3,865 in October 2025 to $5,595 in January 2026 — roughly a 45% rise in four months. When the Iran conflict altered the Fed’s stance in March, ETF flows flipped from record inflows to record outflows, pressuring the market downward.
Central banks, however, operate on decade-scale mandates and larger balance-sheet considerations. They absorbed a portion of that selling and continued buying through the selloff. The ECB noted in its June 2026 International Role of the Euro report that gold has surpassed U.S. Treasuries as the largest reserve asset, accounting for 27% of global central bank holdings versus 22% for Treasuries. That change reflects sustained official buying since 2022 and the price appreciation of existing holdings — both persistent factors not undone by a single quarter’s flows.
Does the central bank bid offset the ETF overhang?
The roughly 298-tonne ETF overhang is real and will limit a near-term rally. But sovereign buyers aren’t going away. The WGC survey found 74% of central banks expect the U.S. dollar’s share of global reserves to decline over the next five years, which supports a long-term shift into non-dollar assets like gold. That structural reallocation is multi-year in nature.
When the ETF overhang eventually clears — whether by prices rising above those investors’ entry levels or simply through time — the central bank bid will still be present. It was active during the selloff and will remain during any recovery. For long-term physical holders of gold and silver, the key question is not this week’s ETF activity but who has the longer horizon, the clearest mandate, and the deepest pockets. The ETF overhang has a finite ceiling; the structural change in central-bank allocations does not.
What should gold investors watch next?
Investors should watch U.S. inflation data closely. The May PCE inflation reading — the Fed’s preferred gauge — can shift rate-hike probabilities and influence ETF behavior. If core PCE prints at or above the 3.3–3.4% consensus, the dollar’s strength is likely to persist and the ETF overhang may remain in place longer. A softer print below 3.3% would reduce September hike odds and could relieve some selling pressure from underwater ETF holders. The next FOMC meeting is scheduled for July 28–29, making incoming macro data especially important.
Stay On Top of Gold & Silver Prices
Get important market alerts sent straight to your inbox.
SOURCES
1. Reuters — Gold ETFs Could See Fresh Outflows on Rising Bets on Fed Tightening, June 24, 2026
2. World Gold Council — ETF Holdings & Flows (June 2026); Central Bank Gold Reserves Survey 2026 (June 16, 2026); Gold Demand Trends Q1 2026 (April 29, 2026); Central Bank Gold Statistics April 2026 (June 3, 2026)
3. Mining.com — Gold Overtakes US Treasuries in Global Reserve Shift: ECB, June 2026
4. CME Group — FedWatch Tool, September 2026 Rate Hike Probabilities, June 25, 2026
Disclaimer: This article is for informational purposes only and does not constitute financial or investment advice. Always consult a qualified financial adviser before making investment decisions.
You May Also like:
- Hawkish Fed, Gold Below $4,000, Silver Below $60 — and a Market That Disagrees.
- Gold Just Broke $4,000. The Mainstream Called the Debasement Trade Dead. They’re Wrong.
- Two Things Are Hitting Gold Simultaneously. Only One Is About Gold.
- Why Is Silver Down 5%? The Gold-Silver Ratio Explains.
- BofA Says Three Rate Hikes. Silver Just Priced In the First One.
- Iran Deal. Oil Falling. A PM Out. Gold Still Above $4,100.
- PCE Drops Thursday. Here’s What It Means for Gold.
Popular Topics
Picked from the archive
-
01
 Topics
Gold Gains as Inflation Boosts Fed Rate-Cut Expectations
-
02
Topics
Gold Price Up 1.5% as ADP, ISM and Beige Book Weigh on Fed
-
03
Topics
Gold Targets Are Falling, but the $8,000 Forecast Holds
-
04
Topics
AI Bubble Fears Surge as Gold Price Falls Below 4,000 USD
-
05
Topics
Silver Price Near $80 as Iran Ceasefire Revives Rate-Cut Hopes
-
06
Topics
Why 72% of Family Offices Don’t Hold Gold: What They’re Missing
-
07
Topics
Gold Up 3% and Silver 7% as Metals Rally to End Q1
-
08
Topics
Invest in Precious Metals in 2026: Why Allocations Are Rising