Use the 50-Day Moving Average to Read Gold and Silver Trends
If you follow gold and silver prices, you know these markets can swing quickly—spikes, pullbacks, periods of consolidation, and sudden rallies often arrive within days. For experienced precious metals investors, one of the simplest and most dependable tools for separating meaningful trend changes from market noise is the 50-day Simple Moving Average (SMA).
This article explains what the 50-day SMA is, why it matters for gold and silver specifically, and how you can use it to make clearer, more disciplined investment decisions. It focuses on practical applications: identifying medium-term trend direction, spotting dynamic support and resistance, and timing entries and exits with less emotion.
What Is the 50-Day SMA?
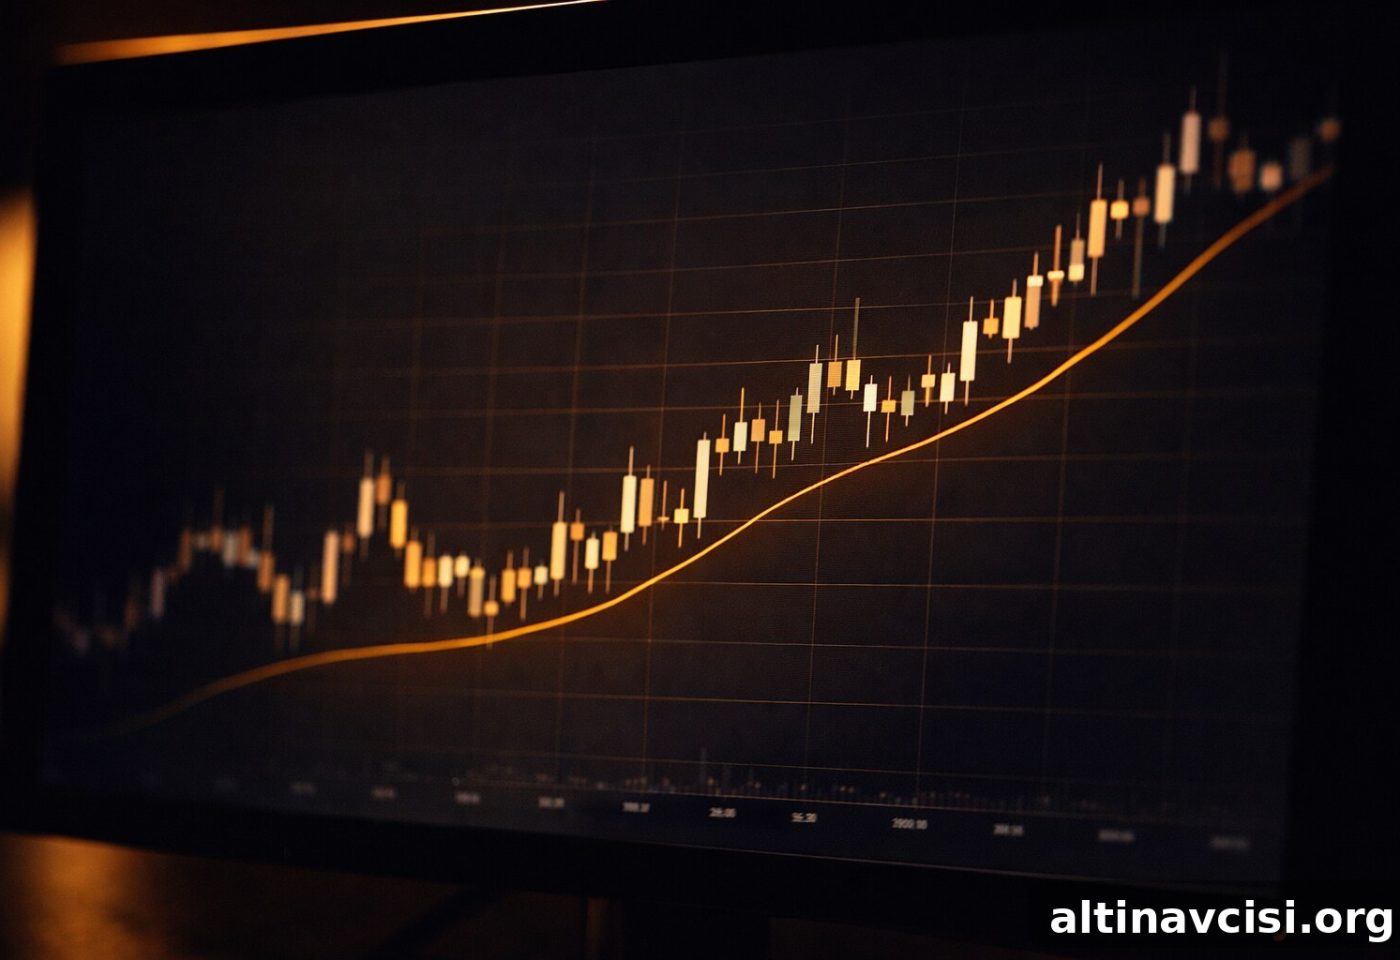
The 50-day Simple Moving Average is a technical indicator that plots the average closing price of an asset over the most recent 50 trading days. With each new trading day, the oldest closing price is dropped and the newest is added, so the plotted line moves over time.
The SMA smooths out short-term volatility and highlights the medium-term trend. Compared with the 200-day SMA, the 50-day line reacts faster to changes in momentum without being overly sensitive to every small fluctuation. That balance makes the 50-day SMA one of the most widely watched indicators among traders and analysts in the precious metals market.

Your Gold Buying GuideMost investors overpay when they buy gold and again when they sell. This short guide explains what to own and why, helping you avoid common mistakes.
Free guide available — sign up on the site to receive it.
Why the 50-Day SMA Matters for Gold and Silver
Gold and silver respond to a mix of macroeconomic factors—inflation expectations, central bank policy, geopolitical developments, and in silver’s case, industrial demand from sectors like solar and electronics. Because their drivers differ from typical equities, trend-following tools can be especially useful to avoid false signals.
When price trades consistently above the 50-day SMA, it generally indicates medium-term bullish control. Conversely, a sustained move below the 50-day SMA points to sellers taking charge and suggests a bearish phase. Silver tends to be more volatile, so its price may cross the 50-day SMA more frequently; that requires additional confirmation before making a trade.
Viewing gold and silver through the lens of the 50-day SMA helps investors avoid two common errors: panic-selling during brief pullbacks inside a healthy uptrend, and holding through the early stages of a legitimate reversal.
The 50-Day SMA as a Support and Resistance Level
A practical use of the 50-day SMA is identifying dynamic support and resistance. In a rising gold market, the SMA often acts as a floor: dips that reach the 50-day line can attract buyers and present disciplined entry points. When the market is declining, the 50-day SMA can serve as resistance, limiting rallies and indicating an ongoing downtrend.
Knowing where the 50-day SMA sits makes it easier to set logical price targets and stop-loss levels tied to market data instead of emotion.
How to Read a 50-Day SMA Signal in Precious Metals
Key interpretations to watch for:
Bullish signal: Price closes above the 50-day SMA after trading below it. Increased volume on the breakout strengthens this signal.
Bearish signal: Price breaks and closes below the 50-day SMA on rising volume, suggesting negative momentum and potential for further downside.
Trend continuation: Price remaining above (or below) the 50-day SMA for a sustained period indicates the current trend is intact. Pullbacks that respect the SMA are often good opportunities to add to positions.
Flat or choppy SMA: A sideways-moving 50-day SMA usually signals consolidation, an environment less suited for trend-following strategies.
Combining the 50-Day SMA with Other Indicators
The 50-day SMA is most effective when paired with complementary tools. Useful combinations include:
50-day SMA + 200-day SMA: A crossover where the 50-day rises above the 200-day—often called a Golden Cross—typically signals a stronger, longer-term bull phase. The reverse is known as a Death Cross and can mark extended weakness.
50-day SMA + Volume: Volume confirms conviction. Breakouts or breakdowns through the 50-day SMA are more reliable when accompanied by above-average volume.
50-day SMA + RSI (Relative Strength Index): If price approaches the 50-day SMA from below while the RSI moves out of oversold territory, the combined signals can point to a higher-probability rebound.
Using the right mix of technical tools alongside the 50-day SMA improves the quality of market reads and reduces false entries.
Gold vs. Silver: Does the 50-Day SMA Behave Differently?
Yes. Silver’s smaller market size and its industrial demand make it inherently more volatile than gold. As a result, silver crosses its 50-day SMA more often and with less reliable follow-through. Traders typically seek confirmation—such as a second consecutive close on the new side of the SMA or corroborating volume—before acting on silver signals. Gold’s moves tend to be cleaner and more dependable for this indicator.
This reflects the broader risk/reward trade-off between the two metals: gold is generally steadier and more conservative, while silver can offer larger upside but with more technical “noise.”
What the 50-Day SMA Can and Can’t Tell You
The 50-day SMA is a lagging indicator based on past prices; it cannot predict the next major move by itself. What it does provide is a straightforward, data-driven framework to judge whether a medium-term trend remains intact. Used consistently, the SMA can reduce emotionally driven mistakes—helping you avoid panic-selling during a routine pullback or failing to recognize a true trend reversal.
Start Using the 50-Day SMA in Your Precious Metals Strategy
The 50-day SMA is simple to apply and widely available on most charting platforms. It doesn’t require advanced trading software or a professional background—what matters is consistency: check the SMA regularly, use it with broader market context, and let the data guide decisions instead of short-term headlines. Whether you’re building a long-term gold position or actively managing silver exposure, observing how price relates to the 50-day SMA will give you a clearer edge in a dynamic market.
Stay On Top of Gold & Silver Prices
Receive timely market alerts and short analysis delivered to your inbox.
Subscribe to receive concise market updates and alerts.
People Also Ask
What is the 50-day SMA and how does it apply to gold and silver prices?
The 50-day SMA averages an asset’s closing price over the most recent 50 trading days. For gold and silver, it smooths short-term noise and highlights medium-term direction, helping investors judge whether the market is in a bullish or bearish phase.
How can the 50-day SMA help identify trends in gold and silver markets?
If price stays above the 50-day SMA, buyers usually control the medium-term trend. If price drops and remains below the SMA, it signals selling pressure. Monitoring this relationship helps distinguish real trend shifts from short-lived price swings.
How do support and resistance levels relate to the 50-day SMA in gold and silver trading?
In uptrends, the 50-day SMA often functions as dynamic support where buyers step in on pullbacks. In downtrends, it can act as resistance that caps rallies. These levels help define entry points, price targets, and stop-losses grounded in the trend.
Does the 50-day SMA work the same way for gold and silver?
Not exactly. Silver’s higher volatility and industrial demand mean it crosses the 50-day SMA more often and with less conviction. Traders typically seek confirmation on silver signals, while gold’s signals tend to be clearer and more reliable.
What are the limitations of using the 50-day SMA for precious metals investing?
The 50-day SMA is a lagging indicator based on historical prices; it cannot foresee future moves by itself. For best results, combine it with other tools—longer moving averages, RSI, and volume—to confirm signals and reduce false positives.
SOURCES
1. Investopedia — Why Is the 50 Simple Moving Average So Common for Traders and Analysts?
2. TradingSim — 6 Guidelines for How to Use the 50 Moving Average
3. Sprott Money — The 80/50 Rule: Gold & Silver Explained
4. Ainsley Bullion — Gold’s 8-Year Cycle Shows Long-Term Potential Ahead
5. GoldSilver.com — Best Tool to Track Gold and Silver Prices Effectively
6. GoldSilver.com — Silver Market Shock: CME Margin Hike Signals Bull Market
7. GoldSilver.com — Gold & Silver Market News and Analysis
This article was prepared by the GoldSilver.com Editorial team for educational purposes only. It is not investment advice. Always research thoroughly or consult a qualified financial advisor before making investment decisions.
You May Also Like
- Best Tool to Track Gold and Silver Prices Effectively
- MARKET CRASH IMMINENT? The “Blood Indicator” Warns of Trouble Ahead
- Barclays’ Market Euphoria Indicator Hits Bubble Territory as Speculation Soars
- Gold On Pace for Historic Annual Return Through Recent Quarters
- “This Is Going to Be Horrific” — The Crisis on the Horizon
Popular Topics
Picked from the archive
-
01
 Topics
Tariffs Boost Gold Prices Despite Weekly Drop Ahead of US Jobs
-
02
Topics
Could Trump’s Trade Wars End a Century of US Dollar Dominance?
-
03
Topics
Gold Tops $5,300 as Fed Meeting Sends Dollar Tumbling
-
04
Topics
Gold vs Silver: Which Metal Fits Your Portfolio?
-
05
Topics
Gold Prices Rise as Dollar Slips Ahead of Fed Rate Decision
-
06
Topics
How to Allocate Gold Between Stocks and Bonds
-
07
Topics
Gold Weekly: $9T Swing, Trump Fed Nominee, Record Premiums
-
08
Topics
Digital vs Physical Gold: What Do You Really Own?