Silver Drops 6% After Jobs Beat; Six-Year Deficit Remains

Key Takeaways
- Silver fell about 6% on Friday after the May jobs report; gold declined roughly 3%.
- May NFP 2026: 172,000 jobs added vs. consensus of 80,000–85,000 — the third consecutive monthly beat.
- Market odds for at least one rate hike by year-end: 67% (CME FedWatch), up from 45% last week.
- About 56% of silver demand is industrial and is structurally unaffected by a single payroll print.
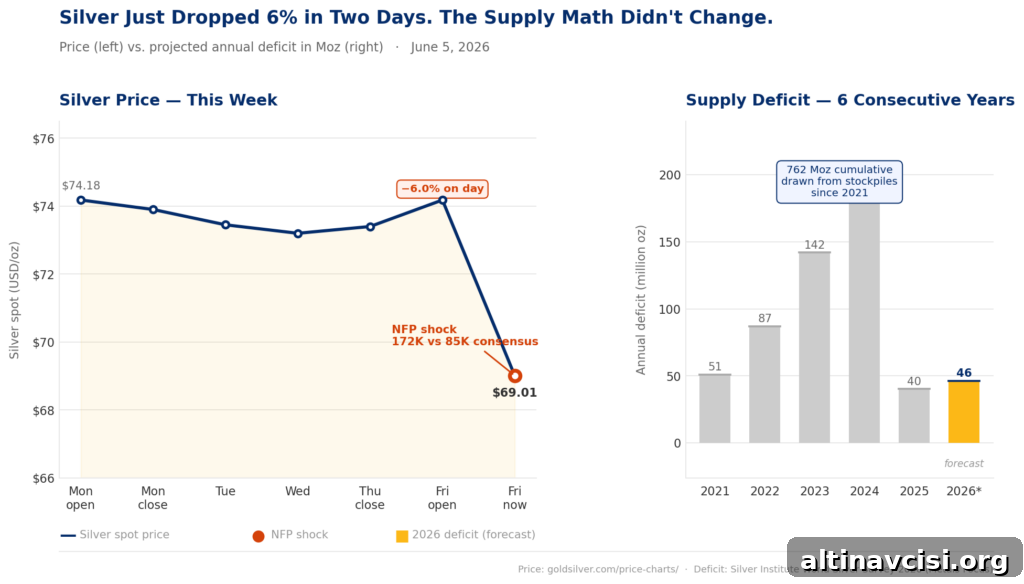
- World Silver Survey 2026 (Silver Institute) projects a 46.3 million ounce deficit — the sixth consecutive annual shortfall and a 15% increase from 2025.
- Cumulative drawdown of above-ground silver stockpiles since 2021: approximately 762 million troy ounces.
- Gold-silver ratio today: near 63, widening because silver dropped more sharply than gold.
Silver is trading near $72 this afternoon, down nearly 6% since Thursday’s close. Gold also fell, but by a smaller margin — about 3%. The pattern is familiar: silver tends to amplify market moves. When it falls, it falls harder; when it rallies, it often outperforms. Part of that behavior is structural: silver is both a monetary metal and an industrial commodity, so it responds to multiple, sometimes conflicting forces.
The immediate catalyst for Friday’s move was the May jobs report. The U.S. economy added 172,000 nonfarm payroll jobs in May, significantly above the Dow Jones consensus range of 80,000–85,000. This marked the third consecutive month of stronger-than-expected payroll gains. The unemployment rate held at 4.3%, and average hourly earnings rose 3.4% year‑over‑year, according to the Bureau of Labor Statistics.
Markets interpreted the strong payrolls as a sign the Federal Reserve is less likely to cut rates in the near term and could even need to raise them. Traders adjusted quickly: the CME FedWatch tool now shows a roughly 67% probability of at least one rate hike before year-end, up from about 45% a week earlier. The 10-year Treasury yield jumped to about 4.54%, and the U.S. dollar strengthened. For silver, that monetary repricing hit one of its two main engines.
Why Does Silver Move More Than Gold?
Silver runs on two engines: a monetary engine and an industrial engine. A jobs report primarily affects the monetary side, not the industrial demand that underpins more than half of silver consumption.
The monetary engine works like this: both gold and silver are sensitive to real yields — the return investors get after accounting for inflation. When rate-hike expectations rise, real yields climb and the attraction of non-yielding assets such as physical metals diminishes. That creates immediate downward pressure on both metals. Friday’s payroll beat tightened rate expectations and lifted real yields, delivering a clear, fast shock to silver’s monetary valuation.
The industrial engine is different. Silver is an essential material in solar panels, electric vehicles, data-center components used in AI systems, and various medical devices. It has the highest electrical conductivity of any element, which is why roughly 56% of global silver demand stems from manufacturing rather than investment or jewelry. Those industrial projects and supply chains do not pause because of a single monthly employment figure. A solar installation schedule or an EV production ramp is driven by long-term contracts, component availability, and capital expenditure plans that evolve over years, not days.
In short: one engine felt the headwind from Friday’s jobs data; the other did not. That divergence helps explain why silver’s price dropped more aggressively than gold’s on the same news.
Has the Silver Supply Deficit Changed?
Not materially. Even though silver’s market price has pulled back sharply from its January 29 all-time high of $121.67, the physical supply-demand backdrop remains tight.
The Silver Institute’s World Silver Survey 2026, the annual benchmark report for the physical market, projects a 46.3 million ounce deficit for 2026 — up from a 40.3 million ounce shortfall in 2025, a 15% increase year-over-year. This marks the sixth consecutive year of a global market deficit. Since 2021, the industry has drawn down approximately 762 million troy ounces from above‑ground stockpiles, a significant cumulative reduction that the Silver Institute describes as “an era of reduced stocks.”
Despite a strong price environment in 2025 — silver averaged about $40 per ounce that year, a roughly 42% annual increase — mine production for 2026 is projected to be essentially flat at about 844 million ounces. New mining capacity typically takes five to ten years to develop, so the supply response to higher prices is slow. For now, the market covers deficits by drawing down inventories, a solution that works for a time but is inherently finite.
What Is the Gold-Silver Ratio Telling Investors?
The gold-silver ratio sits near 63 today, meaning it currently takes about 63 ounces of silver to buy one ounce of gold. That ratio has widened from around 60 last week because silver’s percentage decline outpaced gold’s. Historically, when both metals fall on macroeconomic concerns, silver often overshoots on the downside and then rebounds faster than gold once monetary pressure eases.
Periods of divergence between the two metals tend to compress quickly when the underlying trigger — for example, a sudden shift in rate expectations — fades. Investors tracking the ratio can use it to judge relative value between the metals, especially when industrial demand trends remain intact.
What Does This Mean for Sound Money Investors?
For investors focused on sound money, silver’s price reflects two separate realities at once. The monetary narrative — expectations about real yields and Federal Reserve policy — can reprice market valuations quickly and cause short-term volatility. The industrial narrative — long-cycle demand from solar, EVs, electronics and medical uses — evolves slowly and underpins a persistent structural shortage.
When monetary policy is loose and industrial demand is strong, silver tends to outperform gold significantly. When those forces diverge, silver will often absorb the larger short-term correction. Friday’s jobs report was a reminder of that dynamic: it moved rate expectations and real yields, which hit silver’s monetary valuation, while leaving the industrial picture unchanged.
That distinction matters. One hot monthly economic number doesn’t rewrite the multi-year supply story that has driven cumulative inventory drawdowns since 2021. The World Silver Survey quantifies ounces; market sessions track sentiment. Both matter, but they operate on different timescales.
SOURCES
1. Bureau of Labor Statistics — The Employment Situation, May 2026
2. Axios — Markets anticipate higher interest rates after strong jobs report
3. CNBC — 10-year Treasury yield moves above 4.53% after strong jobs report
4. CNBC — Jobs report May 2026: U.S. added 172,000 jobs, unemployment at 4.3%
5. Silver Institute — World Silver Survey 2026: Sixth Consecutive Annual Market Deficit
6. InvestingNews — Silver Institute: Sustained Supply Deficit Exposes Market to Squeezes
7. MiningVisuals — Silver Supply and Demand: A 2026 Update
8. InvestingNews — Silver’s Record-Breaking Surge: The All-Time High Price
9. Barchart — Gold and Silver Price Analysis, June 2026
10. Trading Economics — Silver Price Chart and Historical Data
11. Morningstar — May Jobs Report Shows Strong Hiring, but a Fed Rate Hike Isn’t a Done Deal
12. RBC Economics — US May Jobs Report analysis
Disclaimer: This article is for informational purposes only and does not constitute financial or investment advice. Always consult a qualified financial adviser before making investment decisions.
You May Also Like:
- Gold Rate Hike Fears Are Weighing on Prices. Here’s the Full Picture.
- Gold at $4,480: Physical Demand Hits a 50-Year Milestone.
- Gold Holds $4,481 With Rate Hike Risk Rising. Here’s the NFP Decision Map.
- Gold Surges 1.5%: ADP, ISM, and Beige Book Trap the Fed.
- Gold at $4,454 Says the Fed Is Trapped. Here’s Why.
- Central Banks Picked Gold Over Treasuries. Should You?
- Central Banks Just Crossed a Line Not Seen Since 1996.
- Factory Costs Hit 82.1. That Number Is Now Working for Your Gold.
- Gold at $4,500: What Fort Knox, China, and Silver Are Telling You.
- Silver Has Two Engines. Stagflation Is the One Condition That Fires Both at Once.
- The Buyer List for Gold Just Got Longer. These Countries Have Never Bought Before.
Popular Topics
Picked from the archive
-
01
 Topics
Timing Gold and Silver Buys with Technical Analysis
-
02
Topics
Why Gold Is Holding at $4,347 While Stocks Hit Record Highs
-
03
Topics
Why Gold Holds Value: The 5,000-Year Truth Investors Miss
-
04
Topics
Gold Price: What Could Drive It to $6,300?
-
05
Topics
Banks Forecast Gold Over $5,400 After Greenland News
-
06
Topics
Gold Near Records as CPI Looms, Consumer Debt at $18.5T
-
07
Topics
Factory Cost Index Hits 82.1: Why It’s Driving Gold Prices
-
08
Topics
Market Update: Gold Steady, Shoppers Cautious, Nvidia Scrutinized