Oil Up 7% Yesterday, Silver Down: Physical Buyers Pivot

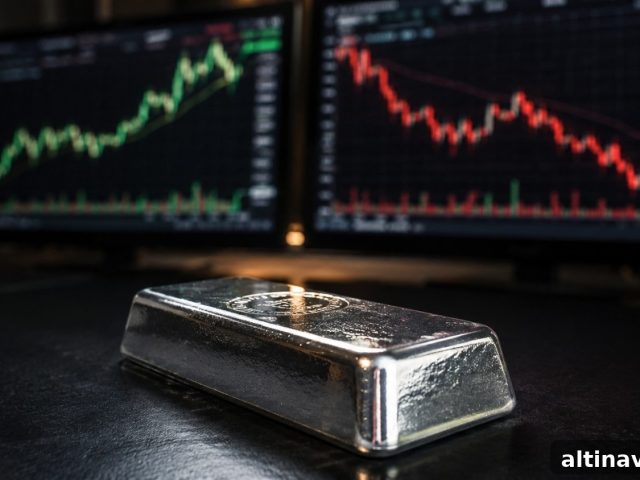
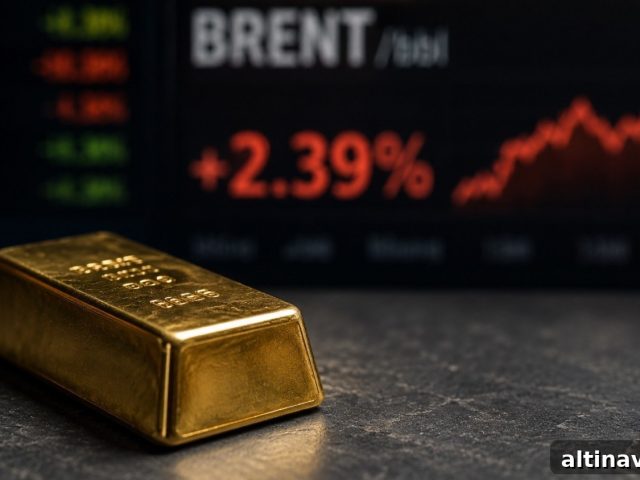
On Thursday, Brent crude jumped about 7% while silver dropped roughly 3%. By Friday morning, Brent had eased back below $100 a barrel and silver had recovered, trading nearly 2% higher. That gap between Thursday’s sharp paper-market selloff and Friday’s physical-market buying is meaningful: it reflects different participants responding to different timelines and signals.
Silver briefly reached an intraday low of $57.21 per ounce during Thursday’s selloff, then recovered to about $58.95 by mid-morning Friday — up roughly 1.6% from Thursday’s close near $58.05. Gold rose more modestly, trading near $4,075 and posting smaller gains. Both metals remain on track for modest weekly increases despite the dramatic reversal on Thursday.
goldsilver.com/price-charts/silver/
▲ +1.6% today
+2.5% this week
Silver spot
Thu Jul 23 — oil shock selloff
Fri Jul 24 — physical buyer recovery
Why Did Silver Sell Off on Thursday?
Three developments converged on Thursday and pushed paper markets to sell silver aggressively. First, Houthi-linked attacks struck two Saudi oil tankers in the Red Sea, triggering a sudden spike in Brent crude that sent prices above $100 per barrel for the first time since May. Second, the European Central Bank kept rates unchanged at 2.25% but signaled a possible hike in September, reinforcing inflation concerns. Third, U.S. initial jobless claims fell to 187,000 for the week ending July 18 — the lowest weekly reading since 1969 — a stronger-than-expected labor print that further raised the odds of future rate hikes.
Taken together, these signals pointed to persistent inflation and continued monetary tightening. Futures markets pushed the probability of another Fed increase into September significantly higher. Higher rate expectations tend to strengthen the dollar and lift Treasury yields, which reduces the appeal of non-yielding metals like silver. The transmission was straightforward: oil shock raised inflation fears, which increased rate-hike odds, lifted yields and the dollar, and pressured silver lower by roughly 3% on the session.

The Edge Every Investor Needs
Smarter precious metals investing starts here. The Nuggets Newsletter delivers market insights, Fed updates, trend analysis, educational videos, and more.
Why Is Silver Recovering on Friday When the Oil Shock Is Still Fresh?
The recovery reflects a split between paper futures and physical buyers. Many futures traders priced in a higher probability of a rate hike in September — a move that affects valuations at longer horizons. Physical purchasers, however, tend to focus on the near-term supply-demand balance and the upcoming Federal Open Market Committee meeting on July 28–29, where a hold is widely expected.
By Friday, Brent had retreated below $100, easing some immediate inflation pressure. The July FOMC meeting is more likely to confirm a pause than to deliver another hike; the true signal will be the Fed’s forward guidance about September. If the Fed adopts dovish language that downplays the odds of a near-term increase, real yields could fall and silver would benefit. Physical buyers who stepped in around the sub-$58 level are either betting on that outcome or viewing the temporary paper-driven drop as an opportunity given the structural market picture.
The gold-silver ratio fell to 69.5 on Friday from 70.72 on Thursday. Silver is outperforming gold in the short term. The 50-year historical average near 65 suggests silver remains comparatively cheap relative to gold.
What Does the Supply Picture Say About Silver’s Price Floor?
Supply has been structurally tight. The silver market posted deficits for several consecutive years, with 2025 continuing that trend. Industrial demand consumes the majority of supply — roughly 58% — driven by solar panels, electronics, and electric vehicles. These end-users do not typically change purchasing plans because of a one-day paper-market move.
Silver also remains far below its recent highs, roughly 51% under its January 2026 peak. Major institutional forecasts and long-term analyst views have not shifted materially in response to a single volatile session. For many physical-market participants, a two-day paper selloff does not alter the structural supply-demand story that underpins their buying decisions.
What Is the Deeper Story Behind Today’s Paper-vs-Physical Divergence?
Paper and physical markets often diverge during episodes of sharp macro volatility. Similar dynamics appeared during the COVID selloff in 2020 and again in 2022, when futures prices dropped while dealer premiums and physical demand remained firm. Over time, the physical market has frequently offered a clearer signal about where prices settle months later. Investors who distinguish between short-term futures-driven moves and the longer-term physical fundamentals are better positioned to ride out the noise.
Silver’s structural deficits, heavy industrial demand, and meaningful distance from its all-time highs mean that a single hawkish session is unlikely to permanently reset the market. The physical buying that appeared on Friday supports that view.
What Should Silver Investors Watch Next?
Three near-term catalysts matter. First, the FOMC decision on July 29: the rate call is expected to be a hold, but Fed guidance about September will move market expectations. Second, the June Personal Consumption Expenditures (PCE) inflation reading on July 30: a softer print would reduce the likelihood of an autumn hike and remove a key headwind for silver. Third, monitor the gold-silver ratio: a sustained move below 68 would indicate growing silver strength relative to gold, while a return above 71 would suggest the paper-market selling pressure is reasserting itself.
Stay On Top of Gold & Silver Prices
Get important market alerts sent straight to your inbox.
SOURCES
1. Reuters — Gold softens on prospects of Fed rate hikes as Brent tops $100, July 24, 2026
2. CNBC — Brent crude crosses $100 after tankers reportedly struck off Saudi Arabia, July 23, 2026
3. MINING.COM — Gold price retreats as oil nears $100 and silver falls sharply, July 23, 2026
4. FXStreet — Silver price rises on July 24, 2026
5. U.S. Department of Labor / AP — U.S. filings for unemployment aid fall to 187,000, fewest since 1969, July 23, 2026
6. CME Group — FedWatch Tool (rate probabilities for July 2026 FOMC)
7. Silver Institute — World Silver Survey 2026 (research by Metals Focus)
8. GoldSilver.com — Live silver and gold spot prices, July 24, 2026
9. Business Recorder — Gold softens on prospects of Fed rate hikes, July 24, 2026
10. The Hill — Houthis report attacks on Saudi tankers in the Red Sea, July 23, 2026
Disclaimer: This article is for informational purposes only and does not constitute financial or investment advice. Always consult a qualified financial adviser before making investment decisions.
You May Also Like:
- Newmont Earned $2.2 Billion Last Quarter. Gold Was Down 13%.
- The U.S. Has Over $1 Trillion in Gold. Washington Carries It on the Books at $11 Billion.
- 187,000 Jobless Claims. The Lowest of 2026. What It Means for Gold.
- A War Just Expanded Into a New Shipping Lane. Gold Fell. Why It Happened.
- Gold Is About to Trade 24/7. A Prediction Market Filed to Make It Never Expire.
- Gold Hit a Two-Week High This Morning. Three Forces Arrived at Once.
Popular Topics
Picked from the archive
-
01
 Topics
Central Banks Favor Gold Over the Dollar: Impact on Your Savings
-
02
Topics
Record Gold ETF Outflow Sparks Debate as China Disagrees
-
03
Topics
Is Gold Still a Safe Haven in War? Investor Insights
-
04
Topics
Gold Near $4,330 as 70% Rate-Hike Odds Rise, China Intervenes
-
05
Topics
Jobs Beat, Ceasefire, Deficit: Impact on Gold Prices
-
06
Topics
Silver Price Spikes to $69.85, FOMC Erases Gains
-
07
Topics
Banks Forecast Gold Over $5,400 After Greenland News
-
08
Topics
Why Gold Climbed After an 8% Oil Spike — What’s Different