Robert Kiyosaki Gold Prediction: Buy the Dip or Wait?
Key Takeaways
- Robert Kiyosaki posted a $35,000-per-ounce gold target on March 16, 2026 — a forecast that depends on a systemic financial collapse and represents a low-probability outcome that should not dictate near-term allocation decisions for most investors.
- Major Wall Street institutions set year-end 2026 gold targets in the $4,500–$4,900 range (JPMorgan to Goldman Sachs), a forecast band that assumes consolidation rather than collapse.
- Gold trades near $4,063 today — roughly 27% below its January 29, 2026 intraday all-time high — placing it at a structural discount relative to most institutional forecasts.
- Silver is in its sixth consecutive year of structural supply deficit, with the World Silver Survey 2026 forecasting a 46.3 million ounce shortfall in 2026.
- Dollar-cost averaging removes the need to try to pick a bottom and systematically lowers your average cost over time — a practical approach when forecasts diverge widely.
- Central banks purchased 863.3 tonnes of gold in 2025, well above the 2010–2021 annual average of 473 tonnes, according to World Gold Council data.
Robert Kiyosaki has a long history of market forecasts. Some proved prescient; others did not materialize when he expected. In 2025 he predicted silver would reach $70 within a year; silver later traded above $121 in January 2026. He has also issued crash warnings that led to extended periods without the predicted collapse. That mixed record is useful context when evaluating his current targets.
On March 16, 2026, Kiyosaki posted on X that gold could reach $35,000 per ounce following what he described as “the biggest bubble bust in history.” In May 2026, when gold was trading near $4,500, he added a $200 silver target. Those figures generate substantial online discussion, but they should not be the primary basis for most investors’ allocation decisions.
A more practical starting point is straightforward: gold currently trades around $4,063 per ounce, about 27% below its intraday all-time high on January 29, 2026. That gap — between today’s prices and the peak six months earlier — frames the central question for individual investors: is today a buying opportunity, or do market signals suggest a more bearish outlook?
What Is Robert Kiyosaki’s Gold Prediction, and Why Does It Capture So Much Attention?
Kiyosaki is the author of Rich Dad Poor Dad, one of the best-selling personal finance books. His platform reaches millions, and many followers take his market calls seriously. His core thesis is consistent: fiat currencies lose value over time through government borrowing and central bank money creation, and tangible assets — gold, silver, real estate, and increasingly Bitcoin — preserve purchasing power better than fiat in the long run.
That framework is not fringe; it is similar to the reasoning behind institutional gold buying by central banks and sovereign funds. Kiyosaki departs from mainstream institutional forecasts mainly on timing and scale. His $35,000 gold forecast assumes a hyperinflationary collapse of the U.S. dollar system — a scenario that, while possible in theory, does not appear as the base case in most quantitative institutional models. His longer-term targets posted in 2025 likewise assume multi-decade structural failure rather than more gradual currency erosion.
Kiyosaki points to a real structural concern. As of July 22, 2026, U.S. national debt stood near $39.6 trillion, and annual interest costs exceed $1 trillion. The Congressional Budget Office projects interest as a rising share of federal outlays. When interest burdens grow relative to other major programs, the fiscal arithmetic becomes uncomfortable. That structural pressure helps explain why many institutions are diversifying into gold.
The Knowledge That Changes Everything

Two essential guides — free. Learn why gold matters and why fiat currencies erode purchasing power over time.
(Signup form removed from this version.)
How Do Kiyosaki’s Forecasts Compare to Institutional Gold Price Predictions?
The difference between Kiyosaki’s targets and institutional forecasts comes from two distinct analytical frameworks rather than a simple dispute over competence. Institutional models emphasize real interest rates, currency dynamics, central bank flows, and ETF demand. Recent institutional year-end 2026 targets cluster between roughly $4,500 (JPMorgan) and $4,900 (Goldman Sachs), with other major banks offering forecasts in that band. Morgan Stanley published an upside case near $5,200 for the second half of 2026.
Kiyosaki’s $35,000 target requires not a policy move but a collapse of confidence in the reserve currency. That scenario is not the base case in major quantitative forecasts, which focus on more incremental risks. Treating Kiyosaki’s extreme outcome as the primary allocation signal would be dangerous for most investors.
Where Kiyosaki and institutional investors agree is on direction: many central banks have been accumulating gold. In 2025 official sector purchases reached 863.3 tonnes, one of the largest annual increases on record. Central banks are diversifying reserves, not necessarily because they foresee immediate collapse, but because they seek to reduce exposure to any single currency or system. That structural demand is bullish for gold even without a catastrophic scenario.
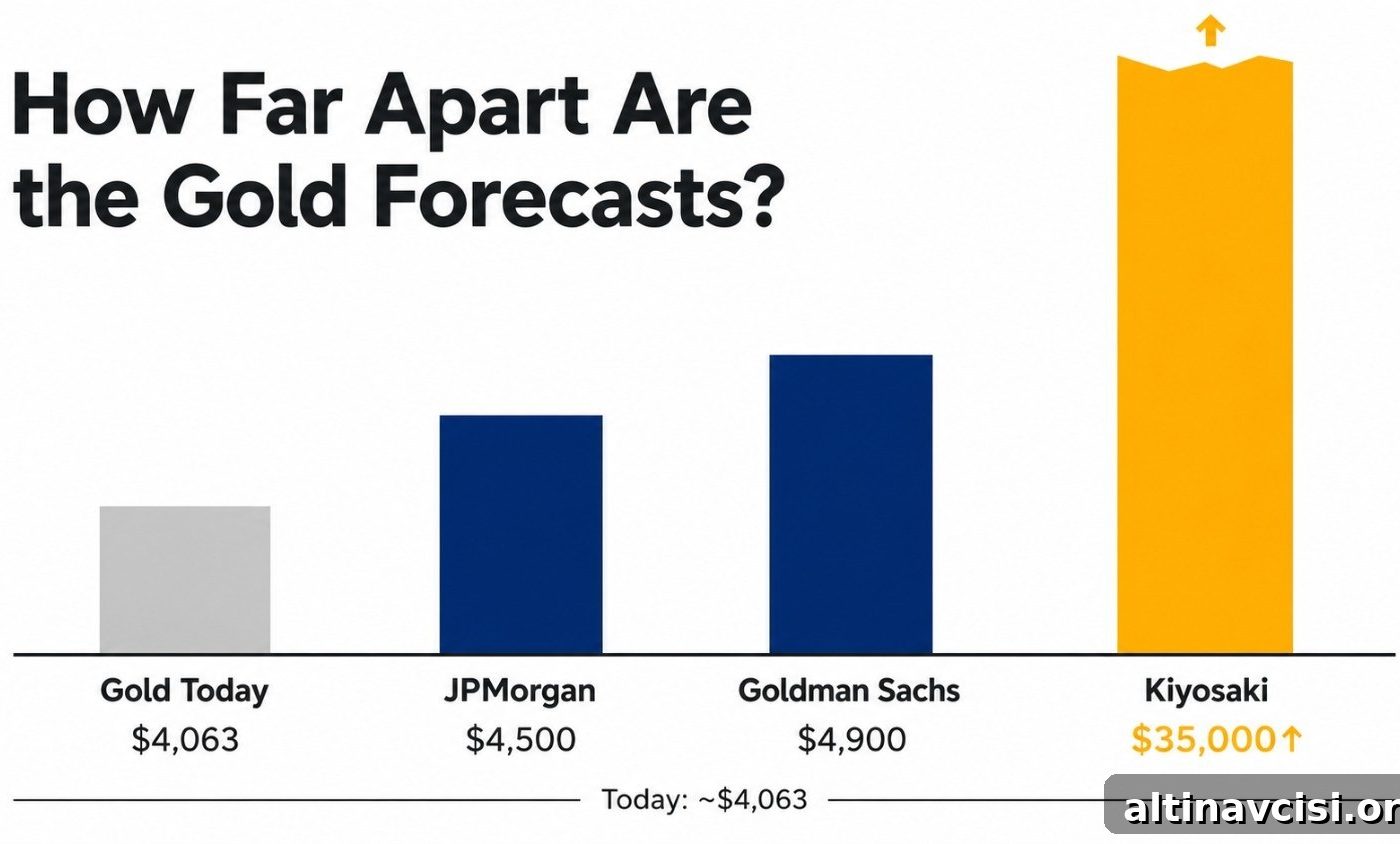
Forecast Comparison (Summary)
Kiyosaki’s $35,000 target implies systemic collapse; institutional year-end 2026 forecasts assume consolidation in the $4,500–$5,200 range.
Institutional year-end 2026 targets
Kiyosaki target (off-scale)
Today: Gold ≈ $4,063. Institutional targets for year-end 2026: approximately $4,500–$5,200. Kiyosaki target: $35,000 (would lie far above the institutional range and the visual scale shown here).
Sources referenced in this article include major bank research reports, central bank and industry data, and price charts from market data providers (source list at the end).
Why Did Gold Fall So Sharply from Its All-Time High?
Gold hit an intraday all-time high on January 29, 2026 and then corrected, trading near $4,063 at the time of this writing — about a 27% decline from that peak. The proximate driver was a geopolitical shock: the U.S.–Iran conflict that began in late February 2026 pushed energy prices higher, lifting headline inflation expectations. Higher inflation then shifted market expectations around Federal Reserve policy from cuts toward holds or even hikes in some pricing, which pushed real yields higher. Because gold pays no yield, rising real yields increase the opportunity cost of holding gold, creating downward pressure on the price.
This correction is largely cyclical rather than structural. The longer-term drivers — fiscal deterioration, central bank diversification, and concerns about currency debasement — remain valid. Institutional analysts have noted that the “debasement trade,” a class of demand tied to fiscal concerns, represents a new component of gold demand that did not exist in the same form in prior cycles. That structural floor remains even while rate dynamics dominate short-term price action.
Is Silver’s Price Correction a Structural Problem or a Buying Opportunity?
Silver closed near $58.55 per ounce on July 24, 2026, down sharply from its intraday all-time high of $121.67 on January 29, 2026. That decline — more than 50% — is larger than gold’s correction and warrants separate consideration.
Silver serves two distinct demand pools: industrial demand (roughly 58% of annual consumption) and investment demand (coins, bars, and exchange-traded products). Industrial uses include solar panels, electric vehicles, semiconductors, and data center infrastructure. When investment demand falls while industrial demand remains steady, prices can decline even as the physical market tightens. That dynamic explains much of silver’s 2026 behavior.
The World Silver Survey 2026 reports the market is in its sixth consecutive year of structural supply deficit, with a projected shortfall of 46.3 million ounces for 2026. Global mine production has been broadly flat near 830 million ounces annually since 2015, so deficits are being met through drawdowns in above-ground stocks. That physical shortage is a durable structural factor even if investment sentiment becomes volatile.
Kiyosaki’s $200 silver target depends on a macro shock scenario. The structural supply deficit, however, does not require a shock; it is a material market reality that supports a longer-term bullish case for silver.
How Should an Individual Investor Think About Buying the Dip?
The practical question is whether to buy now or wait for lower prices. The honest answer is that short-term price direction is unpredictable. Central bank decisions, especially U.S. Federal Reserve rate moves, can swing gold prices materially in either direction. Historically, a 25 basis point cut has been associated with firms seeing increased ETF demand over six months; conversely, holds or hikes weigh on flows.
Given that uncertainty, dollar-cost averaging (DCA) is a robust strategy. DCA means committing a fixed dollar amount to buy physical gold or silver at regular intervals. High prices buy fewer ounces; low prices buy more. Over time this reduces the risk of mistiming the market and smooths the purchase price.
Precious metals are volatile: gold often moves 10–15% within quarters, and silver swings even more. Attempting to pick a precise bottom is effectively a bet on information no one possesses. Spreading purchases over six to twelve months converts timing uncertainty into a systematic advantage.
Allocation size is a separate decision from timing. Many wealth-preservation frameworks recommend 5–10% of a diversified portfolio in physical precious metals to protect purchasing power without overwhelming the portfolio with a non-yielding asset. Investors who assign greater probability to severe fiscal deterioration might allocate more — for example, 15–20% — as a deliberate overweight rather than as an impulsive bet.
What Does Kiyosaki Get Right, and Where Should You Apply Skepticism?
Kiyosaki’s most durable point is the distinction between paper claims and physical ownership. Physical gold and silver carry no counterparty risk: they do not depend on a corporation’s earnings, a bank’s solvency, or a government’s fiscal choices. A metal bar held outside the banking system represents purchasing power that cannot be diluted by a monetary policy decision. That distinction becomes especially meaningful in the extreme scenarios Kiyosaki describes.
Where skepticism is warranted is in his timeline precision and his extreme price targets. A $35,000 gold price requires a systemic event. Systemic events occur, but their timing is notoriously uncertain; designing an entire investment strategy around a low-probability, high-impact scenario risks missing other opportunities and incurring significant opportunity cost. Kiyosaki’s historical calls show directional insight but often imprecise timing, which makes following them for short-term trading hazardous.
The broader structural case he makes — that rising national debt, growing interest expenses, and persistent deficits erode the purchasing power of dollar-denominated savings — does not require a $35,000 price to be actionable. It supports allocating a portion of savings to assets that cannot be debased. That same logic underlies why central banks increased gold purchases substantially in recent years.
Key Considerations Before You Act
Before changing allocations, clarify your objective. If your goal is to protect purchasing power over a 10–20 year horizon, beginning a DCA program at today’s price levels can be sensible. If you expect a rapid near-term windfall, different timing and risk choices apply. Gold’s primary role in a sound-money portfolio is protection, not outperformance relative to equities.
Practical steps: choose an allocation percentage of investable assets; establish a regular purchase schedule (monthly is common); prioritize physical metal if your objective is ownership outside the banking system; and avoid reacting to short-term price swings. Let a systematic plan work over time.
Kiyosaki correctly highlights a real mechanism shaping markets, even if his extreme price targets deserve calibrated skepticism. Whether the U.S. fiscal trajectory ends in abrupt collapse or a slower erosion of purchasing power, the prudent response for many investors remains the same: own some gold and silver, understand the reasons, and position those holdings to match your risk tolerance and investment horizon.
Stay On Top of Gold & Silver Prices
Get market alerts and updates delivered to your inbox.
(Subscription form removed from this version.)
People Also Ask
Yes — directionally and on several occasions — though his timing is often imprecise. He has repeatedly forecast price moves that eventually happened, but not always on the timetable he predicted. That pattern means his views are useful for long-term perspective but risky as short-term trading signals.
“Fake money” is his term for fiat currency — money created by governments and central banks and not backed by a physical commodity. His argument: fiat loses purchasing power over time through monetary expansion, while gold and silver preserve value because their supply cannot be increased by policy decisions.
They serve different goals. A gold ETF offers convenient price exposure and liquidity without storage concerns, but it represents a claim on a trust rather than direct ownership of metal. Physical gold provides direct ownership with no counterparty risk. In an extreme institutional liquidity event, physical metal held outside the banking system can perform differently than ETF shares.
The gold-silver ratio shows how many ounces of silver buy one ounce of gold. The 50-year historical average is about 65:1. When the ratio is unusually high, silver is cheap relative to gold and has historically tended to outperform during recoveries. Investors use the ratio as a relative-value tool to tilt between metals.
Very little. Private U.S. gold holdings represent well under 1% of household financial assets on average. That structural underweight suggests Western retail demand has room to grow, so modest shifts toward gold among households could represent meaningful incremental market demand.
SOURCES
1. Robert Kiyosaki — X posts (March–May 2026).
2. US Treasury Fiscal Data — Debt to the Penny dataset (July 2026).
3. Congressional Budget Office — Budget and Economic Outlook 2026–2036.
4. World Gold Council — Gold Demand Trends Full Year 2025.
5. Silver Institute / Metals Focus — World Silver Survey 2026.
6. Goldman Sachs, JPMorgan, Bank of America, Morgan Stanley — public commodity and research notes (June–July 2026).
7. Market price charts and live spot data referenced for July 24, 2026.
Disclaimer: This article is for informational purposes only and does not constitute financial or investment advice. Consult a qualified financial adviser before making investment decisions.
You May Also Like:
- Gold Risk-Reward Calculator: Is Your Portfolio Actually Safe?
- What Are the Best Physical Precious Metals Products to Buy During a Correction?
- Gold Is Down 26%. Silver Is Down 51%. What Does the Stacker Do Now?
- Gold Allocation Calculator: How Much Should Your Portfolio Actually Hold?
- What Is the Gold Volatility Index (GVZ) — and What Does It Mean for You?
- Gold & Silver Market Correction: Is the 2026 Bull Market Over?
- JPMorgan Cut Its Gold Forecast by 25%. Here’s What Long-Term Holders Need to Know.
Popular Topics
Picked from the archive
-
01
 Topics
Gold Remonetization: 6 Forces Reviving Gold as Money
-
02
Topics
CPI 3.3% and GDP Stalling: Is 2026 Stagflation Coming?
-
03
Topics
Why Is Gold Falling While War Rages?
-
04
Topics
Can Silver Outpace Gold in a Bull Market?
-
05
Topics
Gold Radar: 5 Hidden Signals Your Price Chart Misses
-
06
Topics
Gold Pullback Driven by Treasury Buyback, Not ETFs
-
07
Topics
Hong Kong Completes First Gold Settlement; Banks Also Run London
-
08
Topics
How a Falling Gold/Silver Ratio Impacts Investor Portfolios