Newmont Posts $2.2B Quarterly Profit Despite 13% Drop in Gold
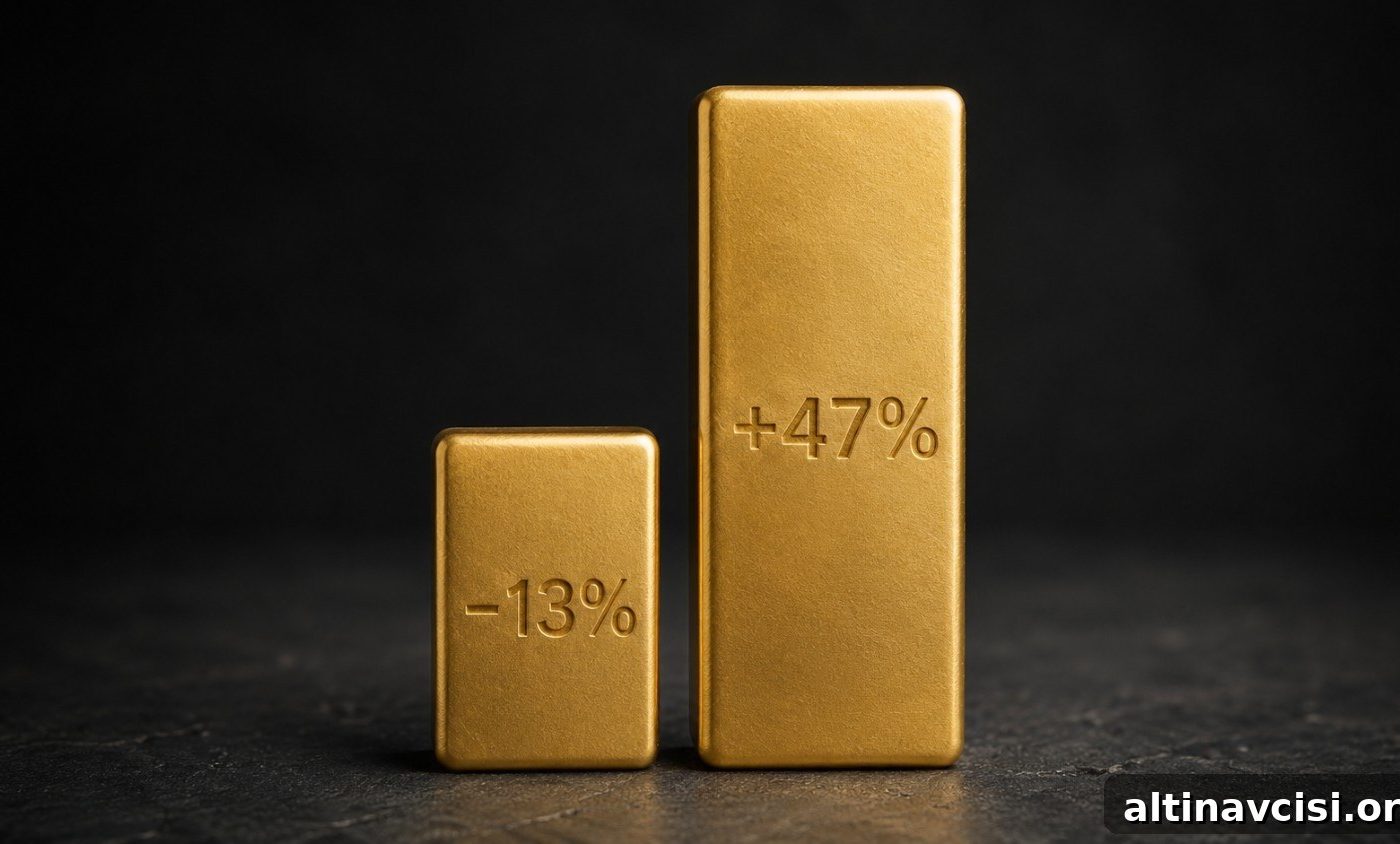
Newmont Corporation, the world’s largest gold miner, released its second-quarter 2026 results on July 23. The numbers surprised many: despite a roughly 13% decline in gold prices from April through June, Newmont delivered a strong quarter — adjusted earnings rose, free cash flow set a second-quarter record, and the company returned a substantial amount of capital to shareholders. These results highlight an important feature of gold mining economics that every investor should understand.
What Is Gold Miner Operating Leverage?
The apparent mismatch between falling spot gold prices and rising miner profitability is explained by operating leverage. Mining businesses carry a large portion of fixed costs: mine development, heavy equipment, processing facilities, long-term contracts, and permitting. Because many expenses do not change directly with short-term price movements, a higher metal price typically delivers outsized gains to a miner’s profit margin. Conversely, when the price falls, margins compress more quickly than the raw percentage change in the commodity.
Newmont reported an all-in sustaining cost (AISC) of $1,621 per ounce in Q2 2026 on a by-product basis, while its average realized gold price during the quarter was $4,414 per ounce. That translates to a gross margin of roughly $2,793 per produced ounce before exploration, growth capital and corporate overhead. With margins at that level, even a material correction in the gold price can leave profitability strong compared with the prior year, provided the year-over-year price remains elevated relative to the comparable period.
The Edge Every Investor Needs
Smarter precious metals investing starts here. The Nuggets Newsletter delivers market insights, policy updates, global trends and educational content to help you follow the sector.
Why Did Newmont’s Earnings Grow Faster Than the Gold Price?
A simple explanation is that, even after the quarterly correction, average gold prices in Q2 2026 were markedly higher than in Q2 2025. A more complete explanation emphasizes the margin effect: Newmont’s higher average realized price in 2026 combined with relatively stable per-ounce costs meant the company retained a wide margin. That pricing advantage, measured against the prior year, produced a substantial increase in adjusted earnings per share — from $1.43 in Q2 2025 to $2.10 in Q2 2026, or roughly a 47% rise.
Revenue grew alongside earnings. Newmont reported $6.12 billion in revenue for Q2 2026, up from $5.32 billion the year before — a 15% increase — and delivered adjusted EBITDA of approximately $3.8 billion. Management also returned $1.9 billion to shareholders through dividends and share repurchases and declared a $0.26 per-share quarterly dividend. Operationally, Newmont produced about 1.3 million attributable ounces in the quarter and maintained its full-year production guidance of approximately 5.3 million ounces.
The one notable miss versus consensus was revenue against analyst forecasts, driven in part by a realized price below some pre-quarter projections. Newmont’s average realized price of $4,414 per ounce sat below some estimates closer to $4,774 per ounce. That shortfall affected top-line expectations but did not undermine profitability because the company’s cost structure allowed it to preserve wide margins.
What Does Newmont’s Q2 Tell Gold Investors About the Structural Case?
Newmont’s results reinforce a structural argument often discussed by precious-metals investors: when gold is priced in fiat currency that is subject to inflationary pressures, the monetary value of an ounce of mined gold can grow faster than the underlying cost base. Over time, if operating costs increase moderately while gold prices outpace them, mining margins expand and cash generation strengthens.
Put differently, even if a miner faces inflation in wages, energy and equipment costs, a larger rise in the metal’s market price increases the dollar margin per ounce. That dynamic helps explain why Newmont recorded roughly $2,793 of gross margin per ounce in Q2 2026 despite a recent pullback from an all-time high.
Management did highlight risks that could affect costs in the second half of 2026, most notably higher oil prices. Fuel is a key input for mine operations — powering haul trucks, generators and processing equipment — and sustained increases in diesel and crude can raise site operating costs. Newmont maintained its full-year AISC guidance at about $1,680 per ounce while noting that fuel contracts and site-specific arrangements provide some mitigation.
Investors should watch upcoming industry quarterly reports and macro events for additional context. Peer results will illustrate whether Newmont’s margin outcome is company-specific or part of a broader sector trend. At the same time, central bank decisions and geopolitical developments that influence oil and currency markets will remain important drivers for both the metals and producer cash flows.
Stay On Top of Gold & Silver Prices
Get important market alerts delivered to your inbox.
SOURCES
1. Newmont Corporation — Newmont Reports Robust Second Quarter 2026 Results, July 23, 2026.
2. Yahoo Finance / Zacks — Newmont Q2 2026 key metrics and analyst commentary, July 24, 2026.
3. GoldSilver — Live gold and silver spot price charts and historical data.
4. News coverage and market reports on oil price movements and geopolitical developments affecting energy and shipping in July 2026.
5. Industry consensus previews for peer producers’ Q2 2026 results and expectations.
Disclaimer: This article is informative only and does not constitute financial or investment advice. Consult a qualified financial adviser before making investment decisions.
You May Also Like:
- The US Has Over $1 Trillion in Gold. Washington Carries It on the Books at $11 Billion.
- 187,000 Jobless Claims. The Lowest of 2026. Here Is What It Means for Gold.
- A War Just Expanded Into a New Shipping Lane. Gold Fell. Here Is Exactly Why.
- Gold Is About to Trade 24/7. A Prediction Market Just Filed to Make It Never Expire.
- Gold Hit a Two-Week High This Morning. Three Forces Arrived at Once.
- The Fed Meets July 29. Gold Says Hold Is Already Priced In. Silver Says Something Else.
Popular Topics
Picked from the archive
-
01
 Topics
Central Banks Favor Gold Over the Dollar: Impact on Your Savings
-
02
Topics
Record Gold ETF Outflow Sparks Debate as China Disagrees
-
03
Topics
Is Gold Still a Safe Haven in War? Investor Insights
-
04
Topics
Gold Near $4,330 as 70% Rate-Hike Odds Rise, China Intervenes
-
05
Topics
Jobs Beat, Ceasefire, Deficit: Impact on Gold Prices
-
06
Topics
Silver Price Spikes to $69.85, FOMC Erases Gains
-
07
Topics
Banks Forecast Gold Over $5,400 After Greenland News
-
08
Topics
Why Gold Climbed After an 8% Oil Spike — What’s Different