
Both metals reclaimed levels not seen since early July. That coincidence masks an important point: understanding why they moved — and why silver outpaced gold — matters more than the raw numbers.
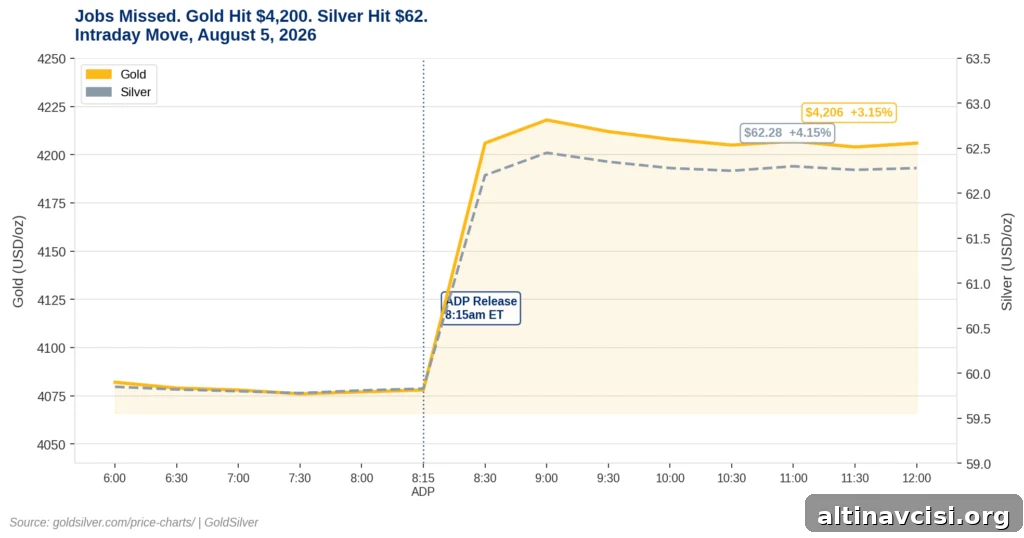
As of the morning update, gold traded near $4,206 per ounce, up roughly 3.15% from the Wednesday open, while silver traded near $62.28 per ounce, rising about 4.15% from its open. Three closely linked forces drove the move, each feeding the same market channel.
Why Did Gold and Silver Surge on August 5, 2026?
Force 1: The July ADP report changed rate expectations. The ADP National Employment Report released at 8:15 a.m. ET showed private payrolls rising by just 44,000 in July, well below consensus and below a downwardly revised June figure. That weak print came on the heels of several weeks of decelerating weekly ADP data. Market participants reacted quickly, reducing the implied probability of a Fed rate hike at the September meeting. Expectations for slower or later tightening reduce upward pressure on rates and shift the macro backdrop for precious metals.
Force 2: Falling hike odds compressed expected real yields. This is the direct transmission from jobs data to gold. Gold prices move inversely to real yields — the nominal 10-year Treasury yield minus 10-year inflation expectations. When traders pull back the expected path for nominal yields in response to weaker data, real yields decline unless breakeven inflation falls by the same amount. That compression in real yields creates a natural tailwind for gold, and today’s ADP surprise materially altered that real-yield calculation. In short, the jobs miss didn’t merely “help” gold; it altered the principal macro input that determines gold’s fair value.
Force 3: Optimism on a Hormuz diplomatic deal eased the inflation outlook. Signals that a diplomatic agreement affecting the Strait of Hormuz was progressing reduced crude oil risk premiums. Comments from Treasury leadership and confirmations that negotiations were underway, even with denials of direct talks from other parties, pushed Brent crude lower by more than 2% in early trading. Lower oil prices weaken near-term inflation pressures and therefore further reduce expected real yields, reinforcing the same channel that lifted gold.
Why Is Silver Outperforming Gold Today?
Silver’s roughly one percentage point outperformance is meaningful and informative rather than random noise.
Silver shares the same sensitivity to real yields and a softer dollar that benefits gold, but it also carries additional exposure to industrial demand. Around 58% of silver’s annual demand comes from industrial uses, including electronics, photovoltaics, and various manufacturing applications. A jobs report that signals economic cooling — but not a collapse — sends a “Goldilocks” signal to industrially sensitive metals: financial conditions ease enough to limit immediate Fed tightening while manufacturing activity remains resilient. That dual exposure gives silver built-in leverage to macro moves that favor precious metals.
The gold-to-silver ratio fell to about 67.5 from roughly 68 last week. For perspective, the 50-year average sits near 65, implying silver remains, on a structural basis, cheaper relative to gold. When silver outperforms on days when gold itself is rallying, that ratio compression is constructive for long-term holders of both metals and can signal catch-up potential for silver.
What Does This Mean for the Structural Case?
Gold reached an all-time nominal high earlier in the year before correcting roughly 25%. That correction was largely mechanical: geopolitical tensions drove oil higher, raising inflation expectations and prompting a more hawkish Fed outlook, which lifted real yields and capped gold’s advance. The recent move represents a partial unwinding of that chain.
Importantly, the structural demand floor for gold has remained sturdy. Central bank purchases stayed elevated through the correction, underscoring that long-term demand trends did not weaken as spot prices fell. In other words, the market saw lower prices even as the institutional buying floor rose — a dynamic that supports a constructive outlook once real-yield pressure moderates.
What Should You Watch Before Friday?
The Bureau of Labor Statistics’ Nonfarm Payrolls (NFP) report on Friday is the decisive market mover this week. ADP offers directional insight but is often revised; past comparisons show ADP tends to differ materially from the official BLS count. A soft July NFP would likely push September hike odds materially lower and extend gains for both metals, while a robust print would revive the hawkish narrative and pressure prices.
Also watch the ISM Services PMI and, in particular, its prices-paid subindex. That measure offers a timely read on service-sector inflation pressures and is closely tracked by market participants as a bellwether for Fed policy. Finally, monitor developments around the Hormuz negotiations and any changes in oil price momentum — those variables feed directly into inflation expectations and thus the real-yield channel that governs precious metal performance.
SOURCES
1. GoldSilver.com price charts, gold $4,206.35 and silver $62.284, as of August 5, 2026 (8:30 a.m. ET).
2. CME Group FedWatch Tool — September 2026 FOMC rate-hike probability.
3. ADP Research Institute — July 2026 National Employment Report (44,000 private-sector jobs; June revised to 95,000), released August 5, 2026.
4. CNBC reporting on market reactions to lower oil and a softer dollar, August 5, 2026.
5. World Gold Council — Gold Demand Trends Q2 2026 (central bank purchases).
6. Silver Institute — World Silver Survey 2026 (industrial demand share).
7. Federal Reserve — FOMC Statement July 29, 2026.
8. Institute for Supply Management — July 2026 PMI reports.
Disclaimer: This article is for informational purposes only and does not constitute investment advice. Past performance is not indicative of future results. Always consult a qualified financial advisor before making investment decisions.
You May Also Like:
- South Korea’s central bank ends a long dry spell and resumes gold purchases.
- Market reactions to diplomatic progress in Hormuz, shifting oil prices, and weekly jobs indicators.
- Why gold is holding near recent levels ahead of a jobs week that could alter rate-hike expectations.
- How manufacturing strength and inflation signals have produced mixed reactions in gold markets.
- The split dynamic this quarter: ETF outflows versus strong central bank buying and what it implies.