IMF Inflation Forecast Shift: What It Means for Gold
Gold and silver market update — May 5, 2026
Key Takeaways
- The IMF on May 4, 2026 effectively abandoned its baseline global outlook and declared its previously framed “adverse scenario” — roughly 2.5% global growth and 5.4% headline inflation in 2026 — to be the working reality rather than a downside risk.
- IMF Managing Director Kristalina Georgieva warned that if the Middle East conflict continues into 2027 and oil rises toward $125 per barrel, inflation expectations could “de-anchor,” a regime change that historically compresses real yields and strengthens gold’s structural case.
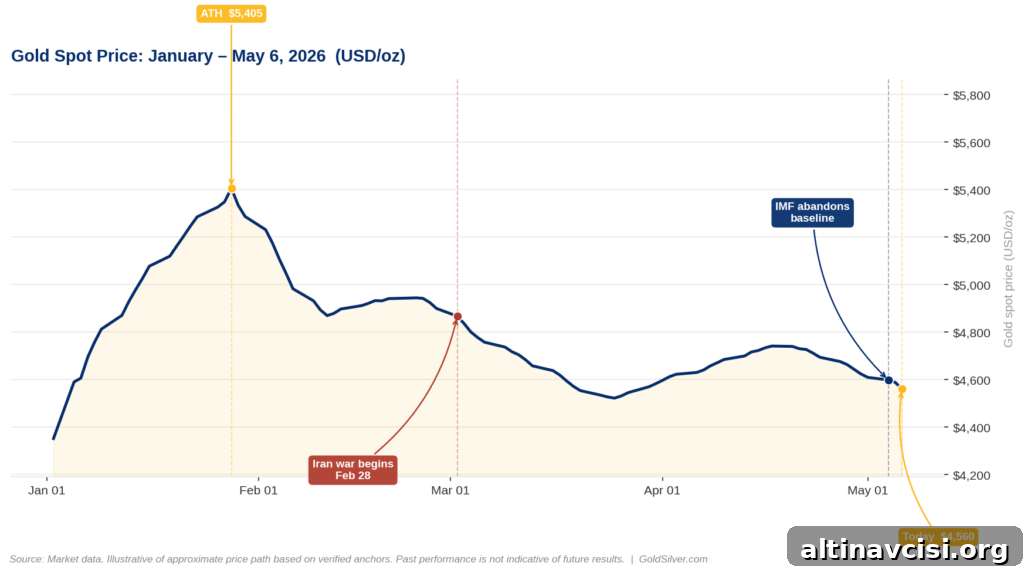
- For holders of physical gold, the quoted price near $4,560 on May 5, 2026, reflects a medium-term dynamic: oil-driven inflation is constraining the Fed’s policy options. The IMF’s shift confirms those pressures are intensifying rather than easing.
The International Monetary Fund spent weeks preparing its economic outlook for 2026. On May 4 in Beverly Hills, the IMF’s managing director said that outlook was effectively obsolete.
Speaking at the Milken Institute Global Conference, Kristalina Georgieva said the Fund’s baseline scenario — which assumed a short-lived Middle East conflict — is “further and further behind in the rear-view mirror.” She declared the world has moved into the IMF’s adverse scenario of slower growth and higher inflation. Gold was trading at $4,560.35 as of May 5, 2026. This article explains why that price and the IMF’s warning belong together.
Why Did the IMF Abandon Its Own Economic Forecast?
On May 4, 2026, Kristalina Georgieva announced that the IMF’s “reference scenario” — the baseline built on a short-lived Middle East conflict — was no longer plausible. That reference scenario had forecast global growth of 3.1% and headline inflation of 4.4% for 2026. By contrast, the Fund’s adverse scenario projects global growth slowing to 2.5% and headline inflation rising to 5.4%.
Georgieva pointed to three factors that have already pushed the outlook to the downside: the ongoing conflict, oil prices at or above $100 per barrel, and broader inflationary pressures spreading through supply chains. For gold investors this matters because the IMF — the institution that oversees the international monetary framework — has publicly closed the door on the benign inflation path that had been keeping real yields elevated and gold subdued.
She also warned of a steeper outcome if the conflict drags into 2027 and oil reaches $125 per barrel. In that case, Georgieva said, inflation would climb further and inflation expectations would risk “de-anchoring.” That warning, and the phrasing itself, is critical: it describes the pathway by which temporary price shocks can become a persistent, self-reinforcing inflation regime.
The Edge Every Investor Needs
Smarter precious metals investing starts here. The Nuggets Newsletter provides concise market insights, Fed updates, and timely analysis.
What Does “De-Anchoring Inflation Expectations” Mean for Gold?
As of early May 2026, inflation expectations remain broadly anchored: markets still expect central banks to restore price stability over time. Georgieva’s warning, though, outlines how that trust can fracture. If expectations de-anchor, the dynamics change in a fundamental way and create a different long-term environment for gold.
When expectations are anchored, wage and price-setting behavior assumes future price stability; firms do not permanently raise prices and workers do not permanently demand larger wages to compensate for expected inflation. If expectations de-anchor, those assumptions break down. Workers seek higher nominal wages in anticipation of rising prices, firms lift prices to cover higher labor costs, and a feedback loop evolves that can embed higher inflation into the economy. Historically, such a regime shift can last for years — often spanning five to ten years — rather than months.
A historical parallel often cited is the United States during the 1970s. A combination of fiscal pressures and delayed monetary tightening allowed inflation expectations to drift higher. After the U.S. left the Bretton Woods gold peg in 1971, gold rose from $35 per ounce to about $850 by January 1980 — roughly a 24-fold increase over nine years. The eventual policy cure involved sharply higher interest rates and a severe recession. The lesson: once inflation expectations become unmoored, the policy response tends to be painful and prolonged.
For gold, the importance of de-anchoring is straightforward. If inflation expectations rise and central banks are constrained in how aggressively they can raise policy rates — for example, because rising rates would balloon sovereign debt service costs — then real yields (nominal rates minus inflation) can stay depressed. Suppressed real yields are a persistent structural tailwind for gold, which does not yield interest but preserves purchasing power when real rates are low or negative.
Georgieva also highlighted that rising input costs are broadening beyond energy. She noted fertilizer prices are already 30–40% higher because of disruptions around the Strait of Hormuz, and that this is expected to push food prices up by several percentage points — a sign that inflation is spreading into essentials.
What Are Central Banks and Major Institutions Doing About It?
One clear institutional response is visible in central bank behavior. The World Gold Council reported that central banks bought a net 244 tonnes of gold in Q1 2026, extending a multi-year pattern of net purchases. These are reserve management decisions, not short-term trading plays. Official buyers appear to be repositioning assets against the risk of de-anchored inflation expectations, constrained monetary policy, and structural pressure on fiat currencies.
At the same Milken Institute panel, Chevron’s CEO noted the physical realities of oil supply. He warned that oil shortages could materialize globally because of disruptions in the Strait of Hormuz, with the first economic impact arriving in Asia. That operational view from a major energy producer complements the IMF’s macroeconomic framing: constrained oil supply can ripple through prices and economic activity, reinforcing inflationary pressure.
The obvious counterpoint is also real: if the Middle East conflict resolves and oil prices fall sharply, inflation pressures would ease and real yields could recover, weighing on gold. That outcome remains possible. However, Georgieva explicitly said the IMF’s earlier “reference case” — which assumed such a resolution — was no longer credible as of May 4, 2026.
What Does the IMF Forecast Shift Mean for Physical Gold Holders?
The IMF does not advocate for gold. It manages the international monetary framework and assesses macroeconomic risks. When its managing director abandons the baseline forecast and warns about de-anchoring inflation expectations, she is identifying the conditions in which gold has historically outperformed paper alternatives.
Mechanically, de-anchored expectations tend to compress real yields because central banks face a difficult trade-off: raise rates sharply and risk a debt-driven recession, or tolerate higher inflation and allow real yields to fall. The U.S. government’s projected interest payments — approximately $1 trillion annually at current rates in fiscal year 2026 — limit the Federal Reserve’s ability to offset inflation with aggressive hikes without precipitating fiscal stress. In that constrained environment, gold benefits as a store of value.
For holders of physical gold, the $4,560 price on May 5, 2026 should be viewed not as evidence that the structural case for gold is failing, but as a price point in a market where oil-driven inflation has constrained central bank options — a pressure the IMF has now confirmed is likely to deepen.
What to Watch: Key Dates for Gold Investors in May 2026
Three near-term data and political events matter:
Friday, May 8 — Nonfarm Payrolls. Consensus expectations for job growth have fallen sharply. A weak payrolls print could revive talk of rate cuts and compress real yields.
Tuesday, May 12 — April CPI (BLS, 8:30 a.m. ET). This is the first CPI release after the IMF formally adopted its adverse scenario. A higher-than-expected print would validate the IMF’s warning and reinforce the inflation narrative.
Friday, May 15 — Fed leadership and policy direction. The timing of the Fed chair transition and related Senate actions could influence market expectations. Any indication of an earlier pivot to cuts or a change in the preferred inflation gauge could shift real-yield expectations and market positioning.
From a technical perspective, watch $4,500 as near-term support for gold. Holding that level amid the data and potential policy developments could set the stage for a move back toward $4,700.
SOURCES
1. Reuters coverage via regional press reporting on IMF remarks at the Milken Institute Global Conference, May 4, 2026.
2. International Monetary Fund — World Economic Outlook, April 2026: Global Economy in the Shadow of War.
3. World Gold Council — Gold Demand Trends Q1 2026.
4. World Gold Council — Central banks and gold demand, Q1 2026 summary.
5. Congressional Budget Office — Budget and Economic Outlook: 2026 to 2036 (debt service projections).
6. U.S. Bureau of Labor Statistics — Consumer Price Index release schedule and data.
7. News coverage and reporting on U.S. Fed nominations and related Senate actions in spring 2026.
Disclaimer: This article is for informational purposes only and does not constitute financial or investment advice. Consult a qualified financial adviser before making investment decisions.
You May Also Like:
- What’s Really Driving Gold Prices Today — 5 Key Signals
- Gold Price and the Jobs Report: A Pre-Market Guide
- The Gold-Silver Ratio Is Expanding — and Being Misread
- Gold, Silver, and Stagflation: 5 Signals That Matter Now
- Why Gold Fell on the Hormuz Tanker Strike
- WGC Q1 2026: What Asia Knows That Wall Street Doesn’t
- BEA Stripped Silver From GDP. Here’s What It Means
- PCE at 3.5%, GDP Miss: Why This Is Bullish for Gold
Popular Topics
Picked from the archive
-
01
 Topics
Tariffs Boost Gold Prices Despite Weekly Drop Ahead of US Jobs
-
02
Topics
Could Trump’s Trade Wars End a Century of US Dollar Dominance?
-
03
Topics
Gold Tops $5,300 as Fed Meeting Sends Dollar Tumbling
-
04
Topics
Gold vs Silver: Which Metal Fits Your Portfolio?
-
05
Topics
Gold Prices Rise as Dollar Slips Ahead of Fed Rate Decision
-
06
Topics
How to Allocate Gold Between Stocks and Bonds
-
07
Topics
Gold Weekly: $9T Swing, Trump Fed Nominee, Record Premiums
-
08
Topics
Digital vs Physical Gold: What Do You Really Own?