Gold Surges Past Wall Street Targets, 4 Banks Split on Outlook

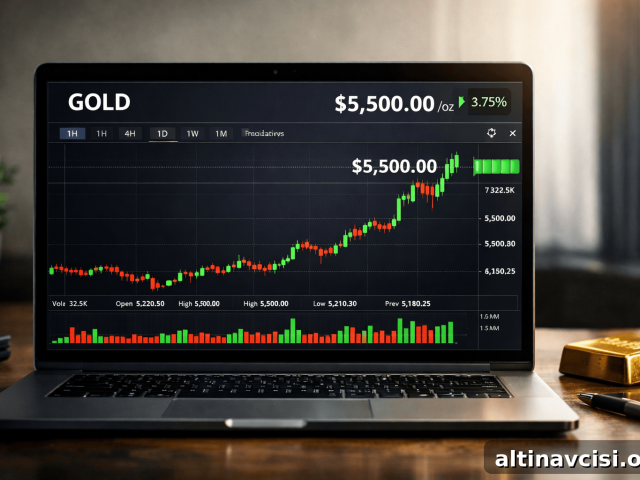
Wall Street spent August revising its gold forecasts, and the market repeatedly outpaced those updates. As of late August, gold was trading near $4,600 per ounce and silver near $68. Between the July 31 close and the August 25 close, gold rose just over 15% while silver climbed just over 19%. That sharp move pushed prices past several 2026 targets that major banks had issued only weeks earlier. Below are five notable developments from the past fortnight and the pattern that connects them.
Why Did Morgan Stanley’s Fourth-Quarter Gold Price Target Get Hit in August?
Morgan Stanley’s Q4 target was reached sooner than the bank expected. On August 20, 2026 analyst Amy Gower reported that gold had hit the bank’s Q4 base case of $4,450 per ounce “faster than expected.” The firm now projects a path that could exceed $5,000 in 2027. It’s important to note that $4,450 represented a base-case estimate, and in April 2026 Morgan Stanley already trimmed its second-half projection from $5,700 to $5,200. Investment flows helped drive the move: gold-backed ETFs absorbed about 70 tonnes across July and August, reversing roughly 93 tonnes of outflows from May and June. Central bank demand also remained a tailwind, with notable additions this year including about 60 tonnes from China and an 82-tonne increase from Poland, bringing Poland’s holdings to 632 tonnes.

The Edge Every Investor Needs
Smarter precious-metals investing starts here. Get timely market insight, clear analysis of central bank activity, and updates that matter to long-term holders.
What Happens When Gold Reaches a Bank’s Year-End Target Four Months Early?
When markets reach a scheduled waypoint early, the forecast often reads more like a timetable than a strict prediction. UBS provides a clear example: its published path called for $4,400 by September 2026, $4,600 by December 2026, $5,000 by March 2027 and $5,200 by June 2027. In August UBS extended that horizon, adding a $5,400 target by end-September 2027. With gold trading near $4,600, the market had already cleared the September waypoint and was effectively at the December figure. UBS also emphasized a supply-and-demand condition: sustaining $5,000 or higher requires roughly 500 tonnes of quarterly investment demand. The bank views pullbacks toward $4,000 as buying opportunities.
Why Did Wells Fargo Cut Its Gold Price Target While Gold Was Rising?
Wells Fargo’s revision lowered a ceiling but did not change the overall direction of its view. In mid-August the bank trimmed its year-end 2026 range to $4,900–$5,100 from $5,300–$5,500, and its 2027 range to $5,400–$5,600 from $5,800–$6,000. Both upper and lower bounds were reduced by about $400. Seen in isolation, the announcement can appear bullish at a $5,100 headline level. Placed in sequence, however, it shows the midpoint falling sharply: earlier in the year Wells Fargo had been far more optimistic, having raised a prior range to $6,100–$6,300. Over roughly six months the midpoint shifted from about $6,200 to roughly $5,000, illustrating how banks adjust their windows as market conditions and near-term momentum change. The bank still expects higher prices and describes the downside as more limited.
Why Are Two Banks Revising Gold Price Targets in Opposite Directions?
They were referencing different short-term windows while reacting to the same market tape. Wells Fargo trimmed its near-term range in mid-August, and five trading days later Citi raised its zero-to-three-month target to $4,800 from $4,500 while leaving its six-to-twelve-month target at $5,000. The key is the starting point: Citi’s raise largely brought its short-term target in line with a market that had already traded above $4,500. Across the main institutions, near-term numbers now cluster roughly between $4,600 and $5,100. One bank reduced its forecast into that band while another raised its into it; that is not a single consensus but a set of windowed opinions reflecting different outlook periods and risk assumptions.
Did One Trader Really Bet $202 Million Against Gold?
No — the trade was profit-taking and a reposition rather than a new short bet. On August 24, 2026, a trader sold about 116,000 September 18 $420-strike calls on the SPDR Gold Shares ETF, collecting roughly $202 million, and simultaneously bought the same number of $430-strike calls for about $144 million. Media headlines described a massive wager against gold, but the activity was actually a roll up the strike: the trader realized profit on existing calls, netted about $58 million in cash, and maintained a bullish exposure at a higher strike. The new calls required the ETF to be above $430 at expiry to pay out; that day the ETF closed near $426.69. The simpler interpretation: the rally had outrun the prior strike and the trader adjusted rather than reversed direction.
What Should a Long-Term Metals Holder Take From This?
One clear lesson emerges. Over a two-week span four major institutions published different near-term gold numbers — some higher, some lower — even though they were looking at roughly the same market. Many revised targets followed price moves rather than leading them. Targets are dated opinions: they reflect sentiment, time horizons and assumptions about demand, not immutable forecasts. For a long-term holder, the metal in your vault has no revision history. Treat published targets as useful context for sentiment and schedule, but keep position decisions grounded in your own horizon, risk tolerance and core reasons for holding precious metals.
SOURCES
1. Morgan Stanley — Gold Price Outlook, analyst Amy Gower, August 20, 2026.
2. UBS — Quarterly gold forecast path and end-September 2027 update, August 2026.
3. Wells Fargo Investment Institute — 2026 and 2027 gold target revisions, August 2026.
4. Reuters coverage — Citi’s 0–3 month gold price target revision, August 24, 2026.
5. CNBC Options Action — Options activity in SPDR Gold Shares ETF, August 24, 2026.
6. GoldSilver — Live gold and silver price charts, late August 2026.
Disclaimer: This article is for informational purposes only and does not constitute investment advice. Past performance is not indicative of future results. Always consult a qualified financial advisor before making investment decisions.
You May Also Like:
- Silver Beat Gold in August. Almost Nobody Said So.
- Americans Spent More in July. They Got Nothing Extra for It.
- The Fed Has Two Hike Numbers Right Now. Almost Everyone Quotes the Wrong One.
- Gold and Silver Pulled Back Today. The Treasury’s Plumbing Explains Why.
- A Stablecoin Issuer Bought More Gold Last Year Than Any Central Bank.
- Two Investors Ran the Debt Math Separately. Both Landed on 15% Gold.
- Gold Nears $4,700, Silver Holds Above $69. Why Is Everyone Waiting on One Friday Speech?
Popular Topics
Picked from the archive
-
01
 Topics
Should You Buy Gold Now During a Dip? Timing and Risks
-
02
Topics
Why Gold Fell While Silver Rose After the Same Report
-
03
Topics
Gold Drops 19%: $3.8B Investor Bet Says It Won’t Matter
-
04
Topics
Seigniorage: How Inflation Acts as a Hidden Tax on Your Dollars
-
05
Topics
Fed Names AI Top Inflation Threat, Gold Reacts
-
06
Topics
Gold Price Tops $5,500 Amid Accelerating Metals Rally
-
07
Topics
Silver Slides While Gold Holds as Markets Reduce Risk
-
08
Topics
HSBC Cuts Gold Forecast by $304, Now Sees $4,750 by Year-End