Silver Outperformed Gold in August: Few Investors Noticed
Many reports picked the same winner for the month — but most of them were wrong.
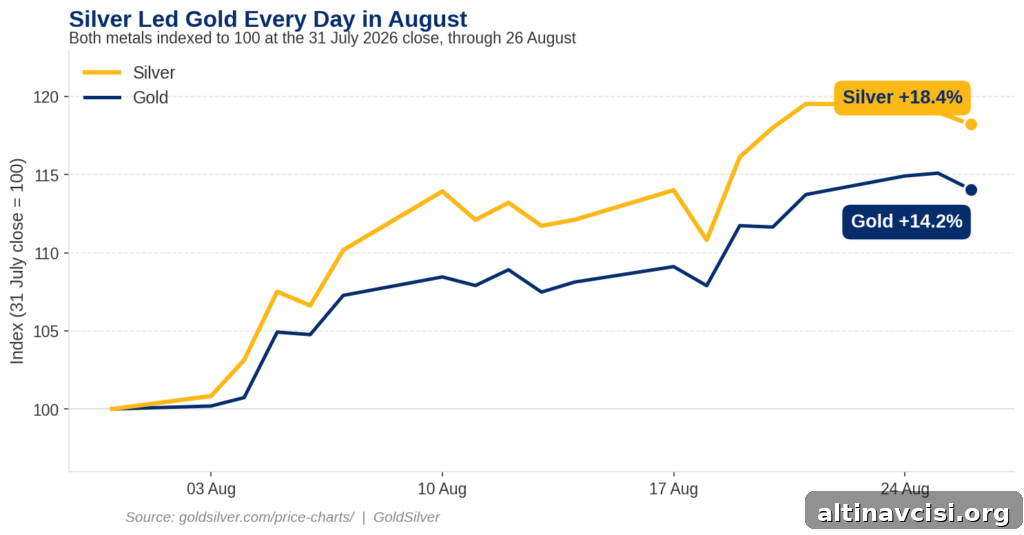
From the close on July 31 through the close on August 25, silver climbed 19.0% while gold rose 15.1%. When both metals are held together, silver, the smaller market, provided the largest lift.
Key takeaways
- Silver gained 19.0% from the July 31 close through the August 25 close; gold gained 15.1% over the same interval.
- The gold–silver ratio fell from 70.1 to just under 68 during that window, indicating silver outperformance relative to gold.
- The 10‑year real yield was 2.38% on August 24 (Federal Reserve data), a level conventional models say should pressure gold — yet both metals rose.
Both metals retreated on Wednesday. Gold is trading just under $4,600 and silver sits in the high $60s. The monthly statistics above are fixed because they measure completed closes.
So which metal had the better August?
Silver did, by nearly four percentage points. Yet much of the financial press framed August as a banner month for gold — with headlines noting gold’s strongest month since September 1999. That focus missed the full picture: silver outpaced gold during the month.
The gold–silver ratio tells the same story from another angle. That ratio measures how many ounces of silver one ounce of gold will buy; its decline through August shows silver’s relative strength. Despite this movement, mainstream conversations emphasized gold roughly eight times for every single mention of silver in the past week. A 19% monthly gain in silver passed with surprisingly little attention.
Why is gold rising when real yields are this high?
This is where standard explanations break down. The 10‑year real yield was 2.38% on August 24, according to Federal Reserve figures — a positive, nearly risk‑free return above inflation. Under classic models, a high real yield should weigh on gold because it raises the opportunity cost of holding a non‑yielding asset. Instead, gold and silver both advanced.
Examining the Treasury curve helps explain why the usual narrative falters. On August 24 the 10‑year nominal yield was 4.70% while the 2‑year yield was 4.24% — a spread of roughly 46 basis points favoring the long end. That term premium implies investors are being paid to hold longer‑dated government debt, not being positioned for imminent rate cuts; yet precious metals remained in demand regardless.
Why did silver move more than gold?
The simplest explanation is market depth. Silver’s market is smaller and less liquid than gold’s, so equivalent buying or selling pressure produces larger percentage moves in silver. The relationship is persistent: in May, for example, silver fell about 12% while gold dropped about 3%, the same dynamic in reverse. Silver tends to magnify moves in both directions, and August was one of the months where that amplification worked to the upside.
Institutional flows also matter. According to mid‑year data, Asian funds led global gold ETF inflows while North America showed net outflows, suggesting Western institutional money joined the rally later rather than leading it. That delayed participation may have shaped price action and helped silver’s sharper ascent once broader buying arrived.
What happened in September 1999?
The frequently cited comparison to September 1999 is useful for context. On September 26, 1999, fifteen European central banks signed the Washington Agreement, capping combined gold sales at 400 tonnes per year for five years. That agreement followed a 20‑year low for gold; the August futures contract had settled at $257.80 in the prior July, and within days the price jumped roughly 14% after the central banks pledged to limit sales.
The similarity to today lies in the scale of the move, not the cause. In 1999 prices rose because officials agreed to withhold supply. Today, the market is rallying amid a backdrop in which governments are acting to support demand for their own debt. The official pressures are different, but the result — a sizable, rapid move in gold — recalls that earlier episode.
More importantly, comparing the two metals shows how they answer the same monetary questions at different speeds. Gold often reacts first to shifts in policy or sentiment; silver tends to follow and then amplify the price move. Observers who watch gold exclusively will see much of the story, but holding both metals captures both the initial signal and the amplified follow‑through.
What should you watch now?
A key near‑term catalyst is the Jackson Hole symposium. Fed Chair Kevin Warsh is scheduled to deliver his first Jackson Hole keynote on Friday at 10:00 ET, and markets will parse his remarks for clues about policy direction. Two trading sessions remain in the month after that speech before the calendar turns to September, historically gold’s weakest month.
Over the past 20 years September has averaged a modest loss for gold (around -0.3%), and the metal finished lower about 60% of the time. Notably, when gold entered September already up by double digits, the month has often trimmed gains: in seven prior occasions where gold was up double digits going into September, four Septembers produced declines.
A record month is not a reliable forecast. Seasonality, Treasury yields, and central bank behavior will all influence whether the rally continues or stalls. Watch real yields, Treasury curve dynamics, ETF flows, and central bank signals to assess the next phase for gold and silver.
SOURCES
1. Federal Reserve Bank of St. Louis (FRED) — Market Yield on U.S. Treasury Securities at 10‑Year Constant Maturity, Inflation‑Indexed (DFII10), August 24, 2026
2. Federal Reserve Bank of St. Louis (FRED) — Market Yield on U.S. Treasury Securities at 10‑Year and 2‑Year Constant Maturity (DGS10, DGS2), August 24, 2026
3. Reuters reporting on gold and dollar dynamics, August 25, 2026
4. World Gold Council — Gold ETF flows and holdings (July 2026 data)
5. World Gold Council — First Central Bank Gold Agreement (Washington Agreement on Gold), September 26, 1999
6. U.S. Commodity Futures Trading Commission — historical report on gold options and activity, 2000 summary of 1999 trading
7. GoldSilver — gold and silver price charts (retrieved August 26, 2026)
Disclaimer: This article is for informational purposes only and does not constitute investment advice. Past performance is not indicative of future results. Always consult a qualified financial advisor before making investment decisions.
You May Also Like:
- Americans Spent More in July. They Got Nothing Extra for It.
- The Fed Has Two Hike Numbers Right Now. Almost Everyone Quotes the Wrong One.
- Gold and Silver Pulled Back Today. The Treasury’s Plumbing Explains Why.
- A Stablecoin Issuer Bought More Gold Last Year Than Any Central Bank
- Two Investors Ran the Debt Math Separately. Both Landed on 15% Gold.
- Gold Nears $4,700, Silver Holds Above $69. Why Is Everyone Waiting on One Friday Speech?
- Gold Hits 3‑Month High as Oil Falls Ahead of Sanctions Announcement
Popular Topics
Picked from the archive
-
01
 Topics
Gold-to-Oil Ratio: How It Impacts the Economy and Portfolios
-
02
Topics
Silver Soars to $75 as Gold Tops $4,500 Amid Stagflation Fears
-
03
Topics
Why Gold Holds Value: The 5,000-Year Truth Investors Miss
-
04
Topics
How Kevin Warsh as Fed Chair Could Affect Gold Prices
-
05
Topics
Gold Price to Hit $5,500 by Q1 2027? Central Bank Risk
-
06
Topics
How the SILVER Act Affects Precious Metals Investors
-
07
Topics
Gold vs Silver: Why Gold Stabilizes Markets, Silver Amplifies
-
08
Topics
Two Numbers in Five Days Will Decide Gold Price Outlook