BLS Revises April Jobs: +64,000 Then -31,000; Gold Reacts

April’s job count was revised up 64,000 and then down 31,000.
This is not a scandal. It is standard Bureau of Labor Statistics (BLS) procedure: initial estimates are revised as additional data arrive. That reality means market reactions to a single monthly payroll print deserve more measured interpretation.
On Friday, September 4, gold traded in the mid-$4,400s and silver in the mid-$66s, both down on the session and well below the late January record highs. Both metals fell sharply immediately after the jobs release, then recovered more than half of their losses within hours.
What Landed at 8:30 a.m. ET?
The BLS reported 162,000 nonfarm jobs added in August, a number that exceeded every published consensus by a wide margin. Survey estimates ranged from roughly 53,000 to 58,000. The unemployment rate remained at 4.1%. The August release also shows the prior twelve-month average at 31,000 jobs per month, the strongest pace since March.
Markets interpreted the stronger-than-expected payroll gain as hawkish: a resilient labor market increases the Federal Reserve’s room to consider another rate hike. Gold briefly touched $4,388.05 at 13:00 UTC before rebounding.
Who bought that rebound cannot be determined from today’s publications. The Commodity Futures Trading Commission (CFTC) positioning report lags and predates both today’s print and last week’s benchmark revision. Any identification of specific buyers would be speculative.

The Edge Every Investor Needs
Smarter precious metals investing starts here. The Nuggets Newsletter delivers essential market analysis, Fed updates, global trends, and educational content.
Why Do Payroll Counts Move Gold So Little?
Because payroll numbers themselves are not the primary driver of gold prices—real yields are. Gold does not produce interest or coupons; its opportunity cost is measured against inflation-adjusted Treasury yields.
As of September 2, the Federal Reserve Economic Data series shows the market yield on the 10-year Treasury inflation-indexed security at 2.45%—a real yield. That real yield, not nominal yields or a single jobs headline, largely determines the cost of holding gold. Markets react when real yields change materially; a payroll print that fails to move real yields much will therefore have limited impact on gold.
Investors and traders frequently weigh the difference between how much Fed rate-hike odds move and how much real yields move in response to economic releases. Payroll figures are important, but the market ultimately prices persistent shifts in real rates rather than every monthly revision.
How Much Does the First Payroll Print Move?
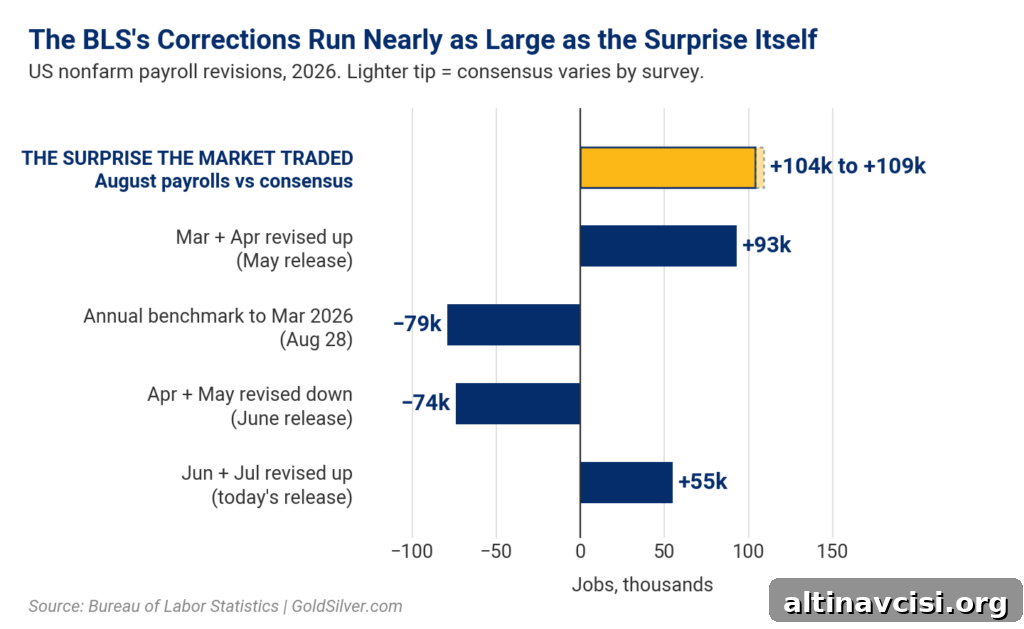
Initial payroll estimates are volatile and often subject to large revisions. In today’s release, the BLS revised June up 11,000 and July up 44,000, so those months are now 55,000 higher in aggregate than previously reported. That illustrates that first estimates can and do shift substantially as new information becomes available.
Past patterns show the size and direction of revisions can vary: earlier in the year, May’s release lifted March and April by 93,000 combined; a later release then cut April and May by 74,000. April’s count was first reported at 115,000, revised up to 179,000, and later trimmed to 148,000. These swings underscore why traders should treat one monthly print with caution—first estimates are provisional.
This morning’s surprise versus consensus was roughly 104,000 to 109,000, depending on the survey. The BLS’s historical corrections to payrolls are often nearly as large as surprising initial prints.
Was the Annual Benchmark Revision Big or Small?
Both. On August 28 the BLS published an annual benchmark revision that reduced total nonfarm employment by 79,000 through March 2026. Relative to the entire employment base, that cut is small—about 0.1%—and below some recent ten-year averages. But relative to the current hiring pace (roughly 31,000 jobs per month), the revision is meaningful: it represents about two and a half months of hiring at that pace.
The benchmark is not punitive; it aligns the monthly survey with state unemployment insurance tax records, a more complete but lagged dataset. That reconciliation produces an improved estimate once each year and can shift the prior months’ totals when better data become available.
What Are the Institutions Doing With It?
Market-implied odds for a September 16 Fed rate decision moved around recent commentary and data. According to CME Group’s FedWatch tool, odds for a September hike were near two-thirds on August 31, fell after comments from a regional Fed governor who suggested he might prefer a hold, and sat roughly at half after today’s payrolls release. Analysts such as Barclays updated forecasts and now expect quarter-point hikes in both September and December in some scenarios. Keep in mind FedWatch probabilities are cumulative across meetings and should not be summed across dates.
Why Does Holding Period Matter More Than the Print?
A trader with a position focused on a near-term Fed meeting needs today’s payroll estimate to be accurate. But an investor with a multi-year horizon is far less affected by a single monthly revision. That distinction separates trading short-term exposure from owning physical metal for the long term.
Holding allocated metal—real physical bullion stored securely—differs fundamentally from owning a claim on a trust or ETF. Allocated ownership makes long-term holding practical, and certain retirement account structures can defer taxes on gains until distribution. Those choices hinge on long-term objectives, not on whether a single 162,000 jobs figure is revised later.
What Should You Watch Next?
U.S. markets will be closed Monday for Labor Day, making today’s close the weekly close. Key upcoming data include August PPI on September 10 and August CPI on September 11—both important for how the Fed assesses inflation. A regional Fed governor has pointed to the inflation prints, rather than jobs, as decisive for his vote. Finally, the Federal Open Market Committee meets on September 16; a hike would move the target range to 3.75%–4.00% from the 3.50%–3.75% level in place since December 2025.
Stay On Top of Gold & Silver Prices
Receive timely market alerts and commentary straight to your inbox.
SOURCES
1. U.S. Bureau of Labor Statistics — Employment Situation Summary, August 2026, September 4, 2026
2. U.S. Bureau of Labor Statistics — Employment Situation News Release Archive, May 2026 Results, June 5, 2026
3. U.S. Bureau of Labor Statistics — Employment Situation News Release Archive, June 2026 Results, July 2, 2026
4. U.S. Bureau of Labor Statistics — Preliminary Benchmark Revision for March Payroll Employment Is −79,000, August 28, 2026
5. Federal Reserve Bank of St. Louis — Market Yield on 10-Year Treasury Inflation-Indexed Securities (DFII10), September 2, 2026
6. CME Group — Tech Earnings Wrap and Shifting Fed Rate Hike Probabilities, September 1, 2026
7. Yahoo Finance — BLS Revises U.S. Job Growth Down 79,000 in Benchmark Update, August 28, 2026
8. Quartz — Barclays Forecasts Two Fed Rate Hikes After Warsh Jackson Hole Speech, August 31, 2026
9. CNBC — U.S. Payrolls Rose 162,000 in August, Much More Than Expected, September 4, 2026
10. GoldSilver — Gold and Silver Price Charts, September 4, 2026
Disclaimer: This article is for informational purposes only and does not constitute investment advice. Past performance is not indicative of future results. Always consult a qualified financial advisor before making investment decisions.
You May Also Like:
- Gold’s Drop Was the Easy Story. The Bond Market’s Non-Reaction Is the Real One.
- Gold and Silver Drop as August Payrolls Blow Past Forecasts. Four Other Threads Moved Today Too.
- The Fed Just Priced Out Half a Rate Hike. Gold Barely Noticed.
- Gold Up, Silver Up. The Five Reasons Behind It Don’t All Agree.
- Barrick Just Delayed Its Biggest Move in Years. Gold Isn’t Why.
- Gold ETF Outflows Came From One Region. The Buying Came From Everywhere Else.
- Gold’s Sellers Are Trading Weeks. Its Buyers Are Counting Decades.
Popular Topics
Picked from the archive
-
01
 Topics
Purchasing Power Explained: How Inflation Erodes Your Savings
-
02
Topics
Gold and Silver Prices Soar After Fed Rate Hike Selloff Reverses
-
03
Topics
Gold ETF Inflows Top 2 Billion as Silver Investors Exit
-
04
Topics
Weaker Dollar, Falling Gold: A Bullish Signal
-
05
Topics
Gold and Silver Prices Jump Amid Strait of Hormuz Tensions
-
06
Topics
Gold Near $4,067 as Jobs Report Fuels Fed Rate-Hike Concerns
-
07
Topics
Silver IRA Guide: Rules, Contribution Limits and Custodians
-
08
Topics
Insurance vs Upside: How Gold and Silver Balance Your Portfolio