Gold Near $4,067 as Jobs Report Fuels Fed Rate-Hike Concerns
Key Takeaways:
- As of August 4, 2026, gold traded near $4,067 an ounce, supported by a softer U.S. dollar and ongoing central-bank purchases despite rising Treasury yields and weaker oil prices.
- Market pricing on August 4 showed a roughly 68% chance the Federal Reserve would raise rates by 25 basis points at its September meeting, according to CME FedWatch data.
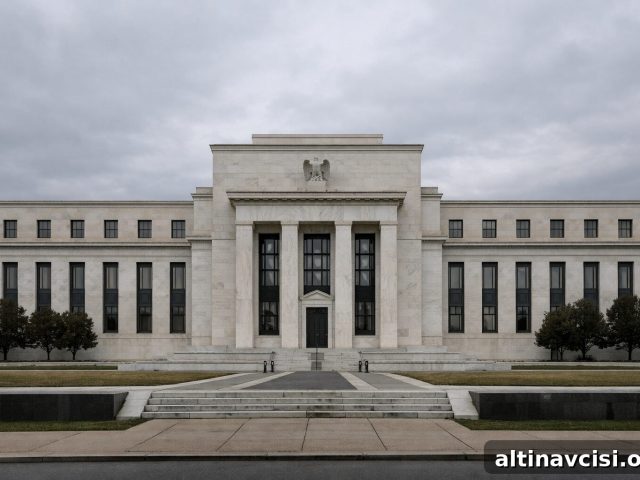
- The Fed left its policy rate at 3.50%–3.75% on July 29, 2026, with three officials dissenting in favor of a hike.
- June’s nonfarm payrolls rose only 57,000, well below expectations, with previous months revised down by a combined 74,000.
- In an environment of sticky inflation and slowing growth—stagflation—gold can remain attractive because it sits outside the traditional monetary policy trade-off.
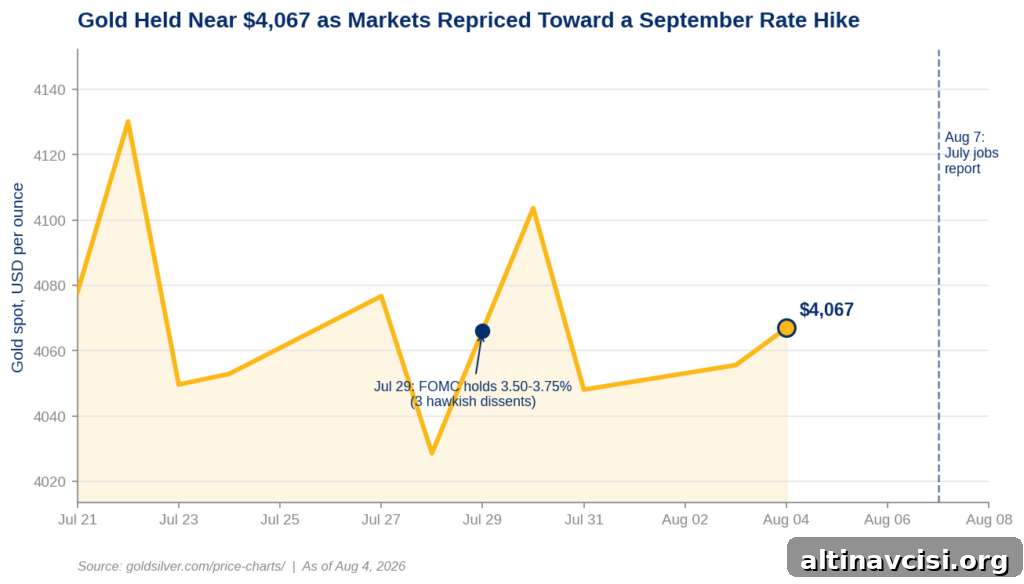
Gold has held near $4,067 an ounce as of August 4, 2026. The metal’s resilience reflects two dominant forces: a softer U.S. dollar and steady buying by official sector buyers such as central banks. Those factors have counterbalanced headwinds that normally weigh on non-yielding assets—namely, a fading geopolitical risk premium that pushed oil lower, and rising 10‑year Treasury yields approaching 18‑month highs. With a crucial U.S. jobs report ahead, investors are watching whether labor-market data will push the Fed toward further tightening in September. Regardless of the outcome, gold has so far shown notable steadiness.
Why is gold so high, holding above $4,000 before the jobs report?
This week presented two classic negatives for gold at once: weakening geopolitical tensions that eased oil prices, and higher real borrowing costs as the 10‑year Treasury yield sat near roughly 4.7%. Ordinarily that mix would press gold lower. Instead, the metal has held its ground because structural buyers and currency moves have offset cyclical pressure.
The U.S. Dollar Index dipped toward the 99.9 area—the weakest level since mid‑June—after intervention to support the yen and broader currency flows. Meanwhile, central banks continue to add to reserves, creating dependable demand that is less sensitive to short‑term headlines. When cyclical drivers like oil and yields reverse, that official-sector buying can provide a firm base under prices, helping gold resist larger declines.
Will the Fed raise interest rates in September?
Markets were leaning toward a September rate hike as of early August. Futures implied roughly a 68% probability of a 25‑basis‑point increase at the September 16 meeting, reflecting the Fed’s July 29 decision to keep the federal funds rate at 3.50%–3.75%. That FOMC statement included three dissents in favor of a hike—the most hawkish split in several years—underscoring lingering concern among policymakers about persistent inflation. Fed officials continue to emphasize a return of inflation to the 2% target as a core objective.
What would a weak jobs report mean for gold?
June’s payroll data already signaled a softer labor market: nonfarm payrolls rose by only 57,000, well below the roughly 110,000 consensus and accompanied by downside revisions to prior months. If Friday’s report repeats that softness, it will complicate the Fed’s decision calculus and could paradoxically increase the perceived risk of additional tightening before the economy cools fully. That scenario typically benefits gold because expectations of policy missteps and slower growth increase demand for non‑yielding stores of value.
Conversely, a strong jobs print—especially when paired with a hot ISM Services reading—would validate hawkish Fed rhetoric, likely pushing yields higher and creating short‑term pressure on gold. Even so, both outcomes can be supportive of gold over different horizons: hot data raises market volatility and real rates; weak data raises recession risk and questions about policy effectiveness. In each case, gold’s role as a hedge versus both inflation and policy uncertainty becomes relevant.
Is this stagflation, and why does gold care?
The current mix—sticky inflation alongside slowing hiring and growth—fits the textbook definition of stagflation. That scenario traps policymakers: raising rates risks deepening the slowdown, while holding rates leaves inflation eroding purchasing power. Either path transfers wealth away from cash holders, and gold is one of the assets that sits outside that policy trade‑off.
Gold carries no counterparty risk and pays no yield that can be repriced by central banks. Historically, when inflation remains elevated while growth weakens, gold tends to attract attention as a monetary metal that can preserve real purchasing power. For investors worried about policy risk and persistent inflation, physical gold can be viewed as an asset you own outright rather than a leveraged or synthetic claim.
What should gold owners watch this week?
The economic calendar builds toward Friday’s July nonfarm payrolls release. Key data arriving earlier in the week includes June JOLTS job openings, ADP private payrolls, and the ISM Services index—an important gauge of service‑sector activity and prices. Economists expected the ISM Services reading near the mid‑50s range, and services inflation remains one of the Fed’s primary focuses. Initial jobless claims and unit labor costs will also provide context before the headline payrolls number.
Rather than trading the headline print, gold holders should consider why the metal can hold value in multiple scenarios: whether the economy prints hotter or colder than expected, the combination of a softer dollar, official demand, and the broader stagflation dynamics can support prices. For those who prefer owning physical metal, the difference between holding tangible bullion and holding paper exposures is a key consideration in periods of policy uncertainty.
SOURCES
1. GoldSilver — Live Gold & Silver Price Charts (data as of Aug 4, 2026)
2. CME Group — FedWatch Tool (data as of Aug 4, 2026)
3. Federal Reserve — FOMC statement (July 29, 2026)
4. U.S. Bureau of Labor Statistics — Employment Situation Summary (June 2026)
5. U.S. Department of the Treasury — Daily Treasury Par Yield Curve Rates (Aug 4, 2026)
6. ICE — U.S. Dollar Index (DXY) (Aug 4, 2026)
7. Institute for Supply Management — Services PMI (early August 2026 estimates)
8. U.S. Bureau of Labor Statistics — Economic release schedule (week of Aug 4–8, 2026)
Disclaimer: This article is for informational purposes only and does not constitute investment advice. Past performance is not indicative of future results. Always consult a qualified financial advisor before making investment decisions.
You May Also Like:
- Manufacturing hit a four‑year high—why gold barely reacted.
- Gold is balancing between a structural bull case and monetary policy constraints.
- The force that pressured gold earlier in the year has partly reversed—what changed.
- Gold ETFs saw outflows while central banks continued large purchases—what that split implies.
- Five reasons gold didn’t rally despite supportive market signals.
- Central banks bought significant quantities of gold even as prices drifted lower.
- How recent PCE readings factored into Fed deliberations and market reactions.
Popular Topics
Picked from the archive
-
01
 Topics
Why 401(k) to Gold IRA Rollovers Lose 20% and How to Avoid It
-
02
Topics
Gold and Silver: Return Drivers Beyond Crisis Hedges
-
03
Topics
Silver Shortage Looms as Solar and EV Demand Soars
-
04
Topics
US Economic Outlook: Surface Strength Masks Deep Risks
-
05
Topics
Bank of America Cuts Gold Forecast — Why That’s Bullish
-
06
Topics
Gold Breaks Through $4,400 as Silver Targets $70
-
07
Topics
How the Current Gold Rally Compares to Past Bull Markets
-
08
Topics
Manufacturing Hits Strongest Month of 2026 as Gold Plunges