Gold-to-Oil Ratio: Down From Last Year, Still Twice Average

Last verified: October 21, 2026.
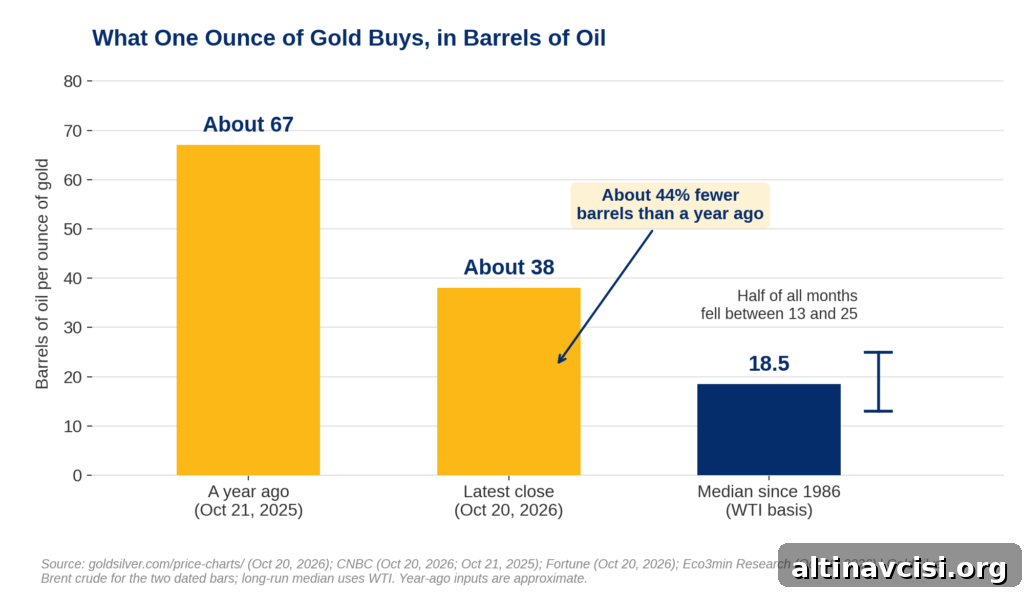
When you price gold in barrels of oil instead of dollars, the story changes. On October 20, 2026, a troy ounce of gold at roughly $4,125 bought about 38 barrels of Brent crude. A year earlier, with the ounce trading at a similar dollar price, that same ounce would have purchased roughly 67 barrels. The shift reflects a sharp rise in oil prices—Brent has climbed about 78% over the year—while gold’s dollar price remained relatively flat.
GoldSilver’s price charts reported gold closing on October 20, 2026 at $4,125.07 (down 0.4% for the day). On the same date, Brent futures settled near $108.79 per barrel. Because gold’s dollar value barely moved while oil surged, the ounce’s purchasing power in terms of barrels fell arithmetically.
Key Takeaways:
- On October 20, 2026 one ounce of gold bought about 38 barrels of Brent crude, down from about 67 barrels a year earlier.
- The change is driven mainly by oil’s rise: Brent is up roughly 78% while gold’s dollar price has been relatively flat.
- Even after oil’s rally, an ounce still buys roughly double the long-run median since 1986 (Eco3min Research puts the monthly median at about 18.5 barrels).
How Many Barrels of Oil Does an Ounce of Gold Buy Today?
As of October 20, 2026, one troy ounce of gold purchased about 38 barrels of Brent crude. By contrast, on October 21, 2025, with gold near $4,115 and Brent near $61, the same ounce bought roughly 67 barrels. The arithmetic is straightforward: with gold unchanged in dollar terms and oil much higher, the ounce now buys about 44% fewer barrels than it did a year ago.
That 44% drop in oil-buying power is meaningful for anyone whose costs are tied to energy prices. For savers and investors who think in terms of real goods or energy units, measuring gold in barrels of oil highlights a different dimension of purchasing power than the dollar price alone.
Is 38 Barrels Still a Lot?
Yes—historically, 38 barrels is a high reading. Eco3min Research’s October 20, 2026 update shows the monthly median since 1986 is around 18.5 barrels per ounce, so today’s ounce buys roughly twice that median. Importantly, the elevated ratio reflects strong gold prices rather than unusually cheap oil in 2026; record-high gold levels are the main reason the gold-to-oil ratio sits well above its long-run midpoint.
Guides to the gold-to-oil ratio typically report post-1970 averages in the 15–20 barrels-per-ounce range. Two caveats apply: many historical series use WTI rather than Brent, which produces different numeric levels, and the ratio has no fixed mean that prices mechanically revert to—being above or below the median is descriptive, not predictive.
What Would Change the Count?
The gold-in-oil ratio depends on movements in two markets. At October 20, 2026 price levels, a $10 change in Brent shifts the ratio by roughly 3–4 barrels per ounce. Conversely, a $100 swing in the gold price changes the ratio by only about one barrel. That asymmetry shows how large oil moves can noticeably alter how many barrels an ounce buys.
To illustrate: holding gold steady at today’s price, bringing the ratio back to the 18.5 median would require Brent near $223 per barrel. Alternatively, holding Brent at today’s price, gold would need to fall to roughly $2,010 per ounce. These are arithmetic examples, not forecasts.
Markets watch central bank decisions for signals on gold’s dollar price. For instance, attention to the Federal Open Market Committee (FOMC) schedule can affect dollar-denominated gold; inflation expectations and rate forecasts influence real yields and, in turn, gold’s appeal.
Why Does Gold’s Dollar Price Weaken When Oil Spikes?
When oil spikes, it can push inflation expectations higher and increase the odds of central-bank rate hikes. Higher nominal rates—if they raise real yields—make non-yielding assets like gold relatively less attractive. That dynamic helps explain episodes where oil rallies and gold’s dollar price softens.
Higher real yields raise the opportunity cost of holding gold. Still, movements in the gold-to-oil ratio are about what an ounce can buy, not about short-term returns. For owners, the crucial number is the ounces-to-barrels ratio because it measures purchasing power in a key commodity.
What Is the Strongest Case Against Reading It This Way?
The main objection is that oil is only one price among many. For people whose expenses track energy, a 44% loss in barrels per ounce over a year is a clear decline in purchasing power. But for someone whose costs don’t track oil, the gold-to-oil view may be less relevant. Past episodes show energy shocks can temporarily weaken gold’s hedge role—Morgan Stanley noted a notable gold sell-off during the first month of the Iran conflict in 2026, when energy-driven market dynamics weighed on gold.
What Does Gold Priced in Oil Tell an Owner?
Pricing gold in barrels of oil tells owners directly what an ounce can buy in energy terms. That perspective complements dollar prices and helps evaluate real-world purchasing power. Central banks can raise rates to cool demand, but higher rates do not produce more barrels of oil. Measuring what money actually buys—whether in energy or other commodities—remains a practical way to assess monetary value.
In short: an ounce buys about 38 barrels today, roughly twice the 1986 median. Each $10 move in Brent changes that count by about 3–4 barrels. For long-term comparisons of gold’s purchasing power, historical series and ratio guides provide useful context.
Stay On Top of Gold & Silver Prices
Receive timely market updates and price alerts delivered to your inbox.
SOURCES
1. GoldSilver – Gold and Silver Price Charts – October 20, 2026
2. CNBC – Oil prices and market coverage – October 20, 2026
3. Reuters (via Business Recorder) – Gold and oil market commentary – October 21, 2026
4. CNBC/Reuters – Gold market coverage – October 21, 2025
5. Fortune – Oil price snapshot – October 20, 2026
6. Eco3min Research – The Gold/Oil Ratio: How Many Barrels an Ounce Buys – October 20, 2026
7. GoldSilver – Gold to Oil Ratio guide – May 19, 2026
8. Morgan Stanley Research – Analysis of gold’s safe-haven role – May 5, 2026
Disclaimer: This article is for informational purposes only and does not constitute investment advice. Past performance is not indicative of future results. Consult a qualified financial advisor before making investment decisions.
You May Also Like:
- Social Security’s 3.6% Raise Arrives Late by Design
- How Gold’s Correction Impacted Portfolios
- Central Bank Gold Buying: Why 39 Tonnes Matters
- Investors Turn to Treasuries as AI Stocks Slide
- London Gold Vault Holdings Rose 3.78% in Q3. What Changed?
- Gold Rebounds Above $4,130: What Changed for Owners?
- How 3.7% Inflation Impacts Wealth Preservation
- Gold and Silver Dip on a Hot CPI Report
- Currency Swing Erases Gold’s Brief Dip
- Short-Term Pressure Pushes Gold Down
Popular Topics
Picked from the archive
-
01
 Topics
Why Investors Choose the Vienna Philharmonic Gold Coin
-
02
Topics
Stablecoin Issuer Outspent Central Banks on Gold Last Year
-
03
Topics
Why Gold Prices Are Falling Amid the Oil War
-
04
Topics
How to Buy Gold in 2026: Step-by-Step Guide for Beginners
-
05
Topics
Silver Appears Weak, Silver-to-Gold Ratio Signals Accumulation
-
06
Topics
Why Gold Prices Are Falling: What Most Investors Get Wrong
-
07
Topics
Should You Still Hold Gold in Your Portfolio?
-
08
Topics
Gold Bars vs Jewelry: Why Investors Choose Bullion