Silver Appears Weak, Silver-to-Gold Ratio Signals Accumulation
Key Takeaways
- The gold–silver ratio closed Friday at 69.3:1, marking its highest weekly close since the spike during the US–Iran conflict. The jump followed the Fed’s unexpectedly hawkish June 17 FOMC repricing, which shifted September rate-hike odds sharply higher in a single week.
- May’s PCE release (headline +0.4% MoM, core +0.3% MoM) trimmed the market’s biggest September-hike probability slightly, sparking a rebound in gold above $4,000 and a modest narrowing of the ratio — the first data-driven hint that the rate-hike narrative may be starting to ease.
- The gold–silver ratio is best read as a regime indicator rather than a price prediction. At 69.3, it signals that expectations about future rate moves are the dominant influence on silver’s price, not shifts in silver’s structural supply or industrial demand, which remain constrained amid a sixth straight annual supply deficit.
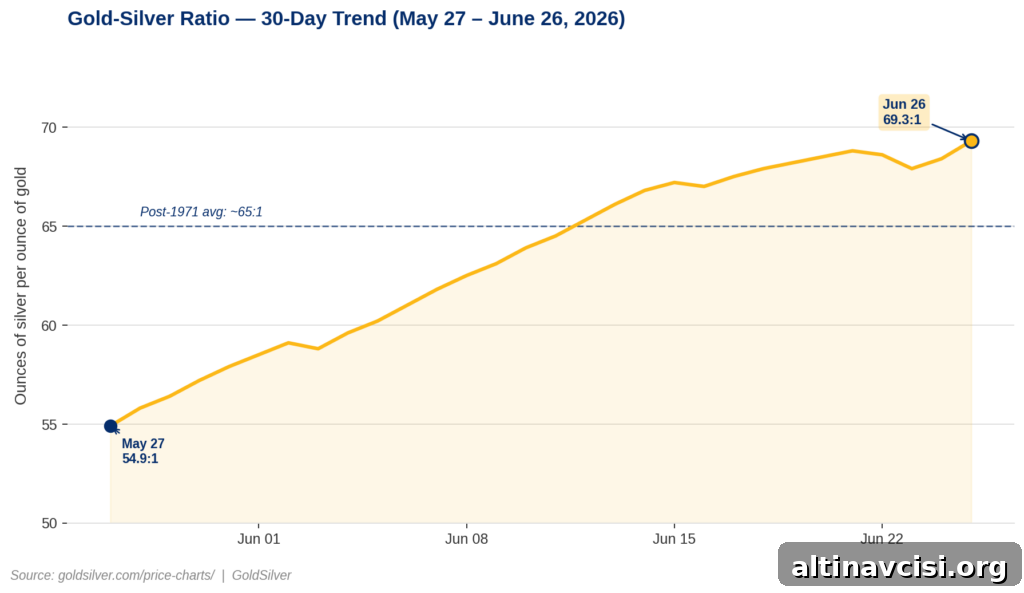
The gold–silver ratio shows how many ounces of silver are required to purchase one ounce of gold. On Friday’s close it stood at 69.3:1 — the highest weekly closing level since the early market turmoil tied to the US–Iran conflict. To put that move in context, a one-point compression when the ratio tightened to 54.9 in late May required a substantial change in silver demand and sentiment. In contrast, three weeks of aggressive Fed repricing in June drove the ratio back above 69:1. That imbalance, driven by a sudden shift in expectations for future interest rates, is the headline story.
As of June 26, 2026, gold traded near $4,044 (+0.44%) and silver near $58.34 (+0.82%), according to publicly available price charts. Both metals closed the week lower as the market absorbed higher odds of additional Fed tightening and a firmer US dollar, which exerted downward pressure on non-yielding assets.
What the Ratio Is Telling You
The ratio is simply the price of one ounce of gold divided by the price of one ounce of silver. At 69.3, it takes roughly 69.3 ounces of silver to buy a single ounce of gold. A rising ratio means silver is getting cheaper relative to gold; a falling ratio means silver is outperforming gold.
Historically, since the end of the gold standard in 1971, the ratio has averaged around 65:1. It reached an extreme of 127:1 during the March 2020 market panic, then tightened dramatically to 54.9 in late May 2026 when a tariff truce and improved industrial demand expectations boosted silver. Today’s level above the long-term average signals that markets are pricing rate-hike risk more heavily than industrial upside for silver — a condition that tends to reverse once rate expectations begin to cool.
The Edge Every Investor Needs
Smarter precious-metals investing starts with timely market context. The Nuggets Newsletter delivers compact market insights, Fed updates, global trends, and clear educational content.
Why Did the Gold–Silver Ratio Widen to 69:1?
Silver is influenced by two distinct forces. Its monetary component tracks with gold — reacting to real yields, inflation expectations, and the dollar. Its industrial component follows demand from sectors like solar, electric vehicles, semiconductors, and data-center infrastructure. Those engines can push in different directions at the same time.
The June 17 FOMC shifted forward guidance noticeably hawkish. Several policymakers projected at least one rate increase before year-end, lifting market-implied odds of a September hike substantially. Higher expected rates raise real yields and the opportunity cost of holding non-yielding metals, putting pronounced downward pressure on silver. While both metals sold off in that repricing, silver’s greater sensitivity to monetary conditions caused the ratio to widen from roughly 62 to 69 over eight trading days.
What the Data Is Missing
May’s PCE inflation figures were collected before oil prices began to reflect the unwind of the Iran–US ceasefire. Any downward effect on inflation from that development will likely appear first in the June PCE report, released in late July 2026. In effect, the Fed’s forward guidance can at times be based on data that misses very recent shifts in commodity dynamics.
The May PCE print showed headline monthly inflation of 0.4% and core PCE of 0.3% — generally in line with expectations — with year-over-year headline PCE at 4.1% and core at 3.4%. After that release, markets trimmed some September tightening odds, and gold recovered above $4,000 while the gold–silver ratio narrowed slightly. That modest compression is the first observable data signal suggesting the Fed-driven regime might be softening.
What History Says Happens Next
The ratio is not a price forecast. It’s a diagnostic tool that highlights when one metal is historically cheap relative to another. At 69:1, silver’s monetary tailwinds are subdued and industrial demand is cautious. Historically, when monetary headwinds ease near the end of a tightening cycle, both silver’s monetary and industrial drivers recover together — providing amplified upside for silver relative to gold.
That dual-recovery dynamic explains why silver can outperform sharply once rate-expectation pressures roll over. The late-May tariff-truce episode illustrated this: the ratio tightened rapidly as industrial demand expectations rose while rate fears eased. The reverse sequence — a tightening of rate expectations — explains the recent widening from roughly 67 to 69:1.
Is the Silver Supply Deficit Still Intact?
Yes. The structural supply deficit in silver has persisted for six consecutive years. Despite reductions in silver intensity in solar panels (about a 19% decline in 2026), mine production has contracted faster than demand has fallen, widening the cumulative deficit. The Silver Institute reports a multi-year drawdown of above-ground inventories totaling hundreds of millions of troy ounces — a long-term trend that does not change with short-term Fed dot-plot adjustments.
Analysts diverge on near-term gold targets: some firms trimmed year-end forecasts after removing expected rate cuts from their models, while others kept more bullish targets intact. Those differences highlight how sensitive precious-metal price forecasts are to evolving rate assumptions. At current prices, the spread between analyst targets implies meaningful potential upside if monetary policy becomes less restrictive than markets currently expect.
What to Watch
The next key release is the June PCE report (scheduled for July 30, 2026), which will be the first official inflation print to reflect oil prices after the Iran ceasefire. If that report shows a meaningful moderation in inflation, markets should reprice lower odds of a September hike and the gold–silver ratio can compress as silver’s monetary engine recovers.
A move from 69 toward 60 would imply silver outperforming gold by roughly 13 percentage points, assuming gold’s price holds steady. Still, the ratio itself is a diagnostic, not a buy signal: it identifies where sentiment has temporarily priced metal relationships, while the underlying supply-demand fundamentals — including the persistent silver deficit and industrial demand tied to the energy transition — remain in place.
This divergence between paper-market sentiment and physical fundamentals creates a potential setup: if rate expectations ease and industrial demand reaccelerates, silver’s dual-engine recovery could drive a meaningful compression of the gold–silver ratio.
Stay On Top of Gold & Silver Prices
Get important market alerts delivered to your inbox.
SOURCES
1. Federal Reserve — Summary of Economic Projections, June 17, 2026
2. Bureau of Economic Analysis — Personal Consumption Expenditures Price Index, May 2026
3. CME Group — FedWatch Tool, June 26, 2026
4. GoldSilver — Live Gold and Silver Price Charts
5. Silver Institute — World Silver Survey 2026 (Metals Focus, April 2026)
6. Goldman Sachs Global Investment Research — Gold Price Forecast Revision, June 19, 2026
7. J.P. Morgan Global Research — Gold Price Outlook 2026
Disclaimer: This article is for informational purposes only and does not constitute financial or investment advice. Always consult a qualified financial adviser before making investment decisions.
You May Also Like:
- Q1 GDP Beat. Jobless Claims Beat. Gold Rose. Here’s Why.
- PCE Hit 4.1%. Gold Went Up. Here’s Why.
- 298 Tonnes of ETF Gold Is Underwater. Central Banks Aren’t.
- Hawkish Fed, Gold Below $4,000, Silver Below $60 — and a Market That Disagrees.
- Gold Just Broke $4,000. The Mainstream Called the Debasement Trade Dead. They’re Wrong.
- Two Things Are Hitting Gold Simultaneously. Only One Is About Gold.
- Why Is Silver Down 5%? The Gold–Silver Ratio Explains.
Popular Topics
Picked from the archive
-
01
 Topics
Why Fed Rate Hike Odds Reached 85% and Gold Climbed
-
02
Topics
Gold Holds Steady as Central Banks Delay Rate Cuts
-
03
Topics
How Profit Booking Works in Gold and Silver
-
04
Topics
Optimize Portfolio with the 80/60 Gold-Silver Rule
-
05
Topics
Why Gold Is Outperforming Nvidia in 2025
-
06
Topics
Gold, Silver Prices Drop as Central Banks Hold Steady
-
07
Topics
How Silver Pricing Works: Spot Price, Premium and Dealer Markup
-
08
Topics
Gold Prices Fall to Seven-Month Low as Geopolitical Fear Fades