Gold, Silver Prices Drop as Central Banks Hold Steady
Today’s top stories for gold and silver investors
After surging to record highs — gold above $5,000 and silver past $100 — both metals are pulling back sharply today. This note explains what pushed prices lower, which macro forces matter most, and what to watch next.
Metals Slide as Central Banks Hold Firm
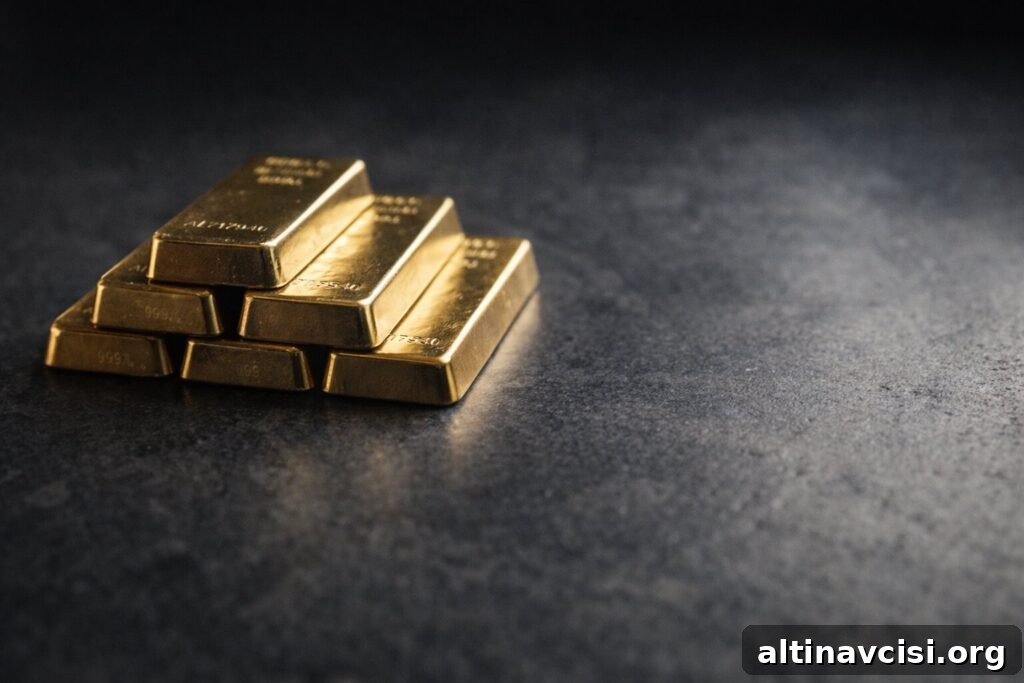
Gold and silver are under material pressure as the macro backdrop has shifted. Gold is down roughly 3–4%, trading near $4,500 after moving above $5,000 earlier this year. Silver has fallen harder intraday — down as much as about 7% — retreating back into a range roughly in the high $60s to low $80s after its run past $100.
What’s Driving Gold and Silver Prices Today
The dominant theme is central bank resolve. The Fed, ECB, BOJ and BOE all held policy settings this week and signaled little willingness to ease quickly — the common message was that rates are likely to stay higher for longer. Markets are repricing rate expectations accordingly, and that shift has immediate implications for metals.
Key pressure points:
- The dollar has strengthened, weighing on dollar-priced commodities. A stronger dollar makes metals more expensive for holders of other currencies and tends to sap demand.
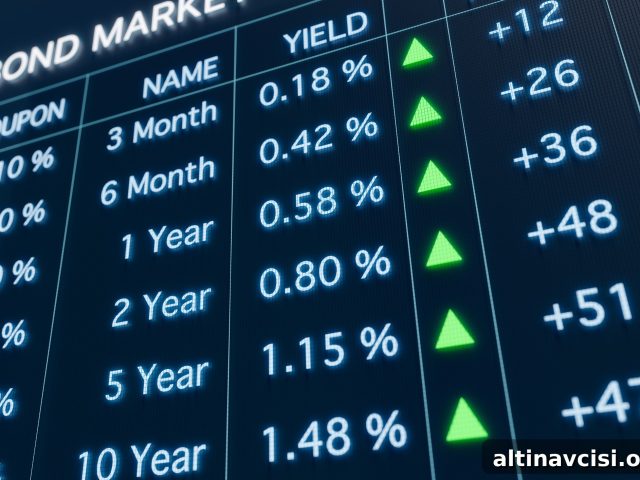
- Long-term yields are rising. The 10-year Treasury yield moved toward the mid-4% area, increasing the opportunity cost of holding non-yielding assets like gold and silver.
- Combined, a stronger dollar and higher yields create a classic macro headwind for precious metals — they become less attractive relative to yield-bearing alternatives.
Is This a Trend Reversal or a Positioning Flush?
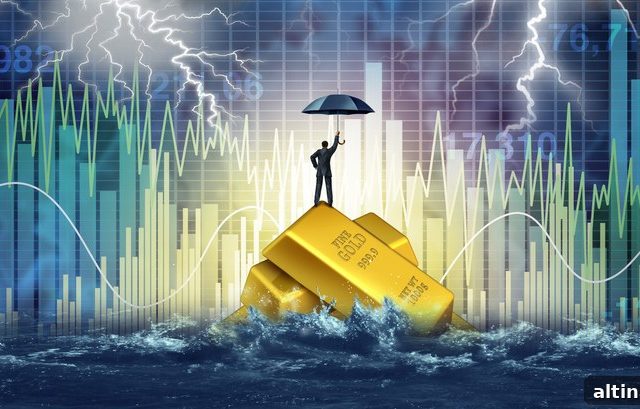
This appears to be a positioning flush rather than a confirmed long-term trend reversal. Both markets experienced parabolic moves into record territory, and parabolic rallies often see sharp, quick retracements when sentiment shifts and crowded positions unwind. A steep 30-day drawdown is painful, but not unusual after rapid speculative advances.
Even after the pullback, silver remains relatively elevated versus gold: the gold-to-silver ratio sits around the low-60s on the most recent close, which still reflects historically elevated silver relative to gold when compared to some long-term averages.
What Will Determine the Next Move?
The immediate path for gold and silver depends on two linked dynamics:
- Long-term yields: If the 10-year Treasury yield stabilizes or falls, pressure on metals should ease. If yields continue higher — pushing meaningfully above the mid-4% area — expect additional short-term selling in non-yielding assets.
- Physical demand and flows: Increased retail and institutional physical buying at lower price levels could provide a floor. Watch gross physical trade volumes, coin and bar premiums, and ETF flows for signs of durable demand entering the market.
For investors, a pragmatic approach is to separate noise from structural signals. Short-term volatility can be sharp; position sizing, risk tolerance and time horizon should drive any tactical choices.
You May Also Like
- Gold Price Drops After Oil Shock — Here’s What’s Really Driving It
- Why Is Gold Falling While a War Is Raging?
- Gold Price Outlook: Fed Holds, PPI Climbs
- Gold Price Today Holds at $5,000 — What’s Driving It
- Gold Price Forecast 2026: Fed, Iran, and the $6,000 Question
This summary is for informational purposes only and does not constitute investment advice. Market prices can change rapidly; verify any critical data with official exchange or market sources before making decisions.
Popular Topics
Picked from the archive
-
01
 Topics
Japan Election Promises and Tariff Fears Rattle Bond Market
-
02
Topics
Global Oil Prices Steady as Travel Demand Rises, Sanctions Loom
-
03
Topics
Gold Holds Above $5,000 as Hedge Funds Brace for Volatility
-
04
Topics
Why Central Banks Are Buying Gold Amid Market Turmoil
-
05
Topics
Gold Hits $4,000: Wake-Up Call for Markets and Policymakers
-
06
Topics
Oil Price Rebounds to $69 as US-EU Trade Deal Nears
-
07
Topics
Gold Prices Surge as Middle East Tensions Escalate
-
08
Topics
Rare Earth Metals Driving the Global Economy