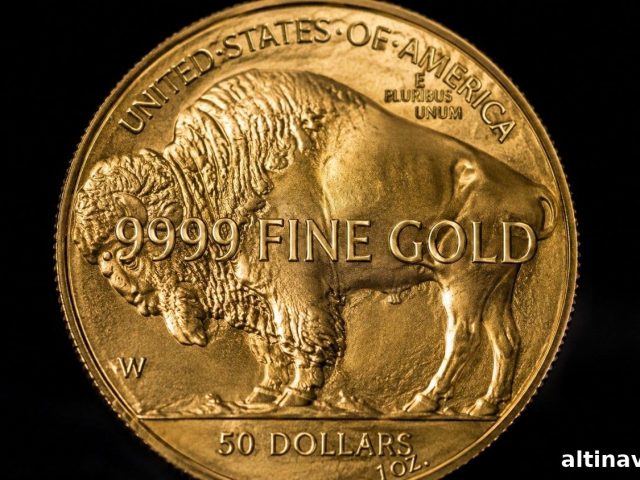
Debt to GDP Ratio: How the US Figure Impacts Gold

Debt-to-GDP appears in virtually every headline about national finances, yet many readers struggle to define it quickly. The concept is straightforward: it compares a country’s government debt to the size of its economy. Understanding this ratio helps explain why gold keeps appearing in conversations about America’s fiscal future.
Key Takeaways
- The debt-to-GDP ratio measures total government debt against annual economic output.
- In Q1 2026 the US ratio was 122.6% (Federal Reserve Bank of St. Louis).
- Total US federal debt exceeded $40 trillion in August 2026 (U.S. Treasury Fiscal Data).
- A rising ratio is not an immediate crisis signal but often accompanies investor interest in safe-haven assets like gold.
- Central banks bought 863 tonnes of gold in 2025 (World Gold Council), reflecting reserve diversification concerns.
What Is the Debt-to-GDP Ratio?
The debt-to-GDP ratio compares a nation’s total government debt with the value of the goods and services it produces in a year (nominal GDP). To calculate it, divide total public debt by nominal GDP and multiply by 100 to express a percentage. A ratio above 100% indicates the government owes more than the economy produces in a year. That fact alone does not prove a crisis is imminent; it simply shows how much annual economic output backs each dollar of debt.
Analysts favor this ratio because raw dollar figures lack context. A $40 trillion debt means very different things against a $30 trillion economy versus a $10 trillion economy. The ratio highlights whether debt is growing faster or slower than the economy and therefore provides a clearer sense of sustainability.
The Knowledge That Changes Everything

Two concise guides — free. Learn why gold matters and the weaknesses built into fiat currency systems.
How Is the Debt-to-GDP Ratio Calculated?
The calculation is straightforward: total public debt divided by nominal GDP, multiplied by 100. In the United States, total debt includes debt held by the public plus intragovernmental holdings such as Social Security trust funds. GDP figures come from the Bureau of Economic Analysis each quarter. Because GDP is the denominator, a fast-growing economy can lower the ratio even if debt increases, which explains why the ratio fell after World War II despite high nominal debt.
What Is the Current US Debt-to-GDP Ratio?
As of the first quarter of 2026, the US debt-to-GDP ratio was 122.6% (Federal Reserve Bank of St. Louis). That level ranks among the highest in the historical series extending back to 1966. The pandemic produced an even larger spike in 2020, when the ratio briefly climbed above 130%.
Dollar totals are rising as well: total public debt surpassed $40 trillion in August 2026 and was near $40.1 trillion in late September (U.S. Treasury Fiscal Data). The Congressional Budget Office projects debt held by the public will rise from roughly 101% of GDP in 2026 toward 120% by 2036, a pace that would exceed the World War II peak by some measures.
Why Does the Debt-to-GDP Ratio Matter for Investors?
A high and rising ratio raises several investor concerns. First, can the government service its debt without crowding out other spending? Interest costs alone now approach roughly $1 trillion per year, creating pressure on discretionary budgets. Second, how will policymakers address the imbalance — through spending cuts, higher taxes, policies to boost growth, or currency weakening? Third, will demand for government bonds remain steady if confidence slips?
There are no simple answers, but these questions affect currency risk, interest-rate expectations, and the allocation of long-term savings.
How Does a Rising Debt-to-GDP Ratio Affect Gold Prices?
Gold is influenced by several factors beyond the debt-to-GDP ratio, but a rising ratio often coincides with conditions that support bullion: concerns about currency debasement, falling real yields, and diminished trust in fiscal discipline. Financial repression — when central banks keep interest rates below inflation to reduce the real value of debt — is one historical pattern associated with elevated debt ratios and stronger gold demand.
Reserve managers have acted on diversification motives: central banks purchased 863 tonnes of gold in 2025 (World Gold Council), following record buying in prior years. In late January 2026, gold reached an all-time price high near $5,589 per ounce (CME), a period that renewed focus on fiscal imbalances in the United States.
What Can History Teach Us About Debt and Gold?
History is instructive but not definitive. The US debt-to-GDP ratio last approached today’s levels in 1946, when wartime borrowing hit about 106%. That era operated under fixed gold prices, so it does not reflect open-market gold dynamics. The 1970s provide a more relevant example: a weak dollar, rising deficits, and the end of gold’s fixed price produced a prolonged gold bull market.
More recently, the ratio crossed 100% in 2020 amid near-zero policy rates and large central bank asset purchases, a backdrop that coincided with negative real yields and increased interest in gold. In practice, the ratio interacts with interest rates, inflation, and public confidence to influence markets.
How Can Investors Respond to a Rising Debt-to-GDP Ratio?
No strategy fits every investor, but common responses include broadening diversification beyond dollar-denominated assets, monitoring real interest rates rather than nominal rates alone, and considering physical precious metals as part of a long-term hedge against currency debasement. For those holding metal, secure, insured storage outside the banking system is often part of a sovereign-risk hedge.
Stay On Top of Gold & Silver Prices
Get important market alerts sent straight to your inbox.
People Also Ask
A high ratio signals a large debt burden relative to the economy and can constrain fiscal options and raise borrowing costs. Context matters: Japan has carried a ratio above 200% for years without a crisis because much of its debt is domestically held. The US ratio warrants attention; the trend and underlying drivers matter more than any single number.
There is no universally agreed cutoff. Sustainability depends on interest rates, growth prospects, and tax capacity. Some research highlights around 90% as a level where growth headwinds may become more likely, but the relationship is complex and not precise.
The US ratio ranks among the highest of major developed economies. It is lower than Japan’s and Italy’s but higher than most other G7 economies. A meaningful share of US debt is owned by foreign investors, which makes Treasury demand sensitive to global sentiment.
Central banks frequently cite diversification as their main motive. Gold carries no counterparty risk and can reduce reliance on any single sovereign bond. That rationale helps explain significant central-bank buying in recent years.
SOURCES
1. Federal Reserve Bank of St. Louis (FRED), “Federal Debt: Total Public Debt as Percent of Gross Domestic Product” (GFDEGDQ188S).
2. U.S. Treasury Fiscal Data, “Debt to the Penny”.
3. Congressional Budget Office, “The Budget and Economic Outlook: 2026 to 2036” (Feb. 11, 2026).
4. Bureau of Economic Analysis, Gross Domestic Product data.
5. World Gold Council, central bank gold reserve statistics.
6. International Monetary Fund, cross-country government debt data.
Disclaimer: This article is for informational purposes only and does not constitute investment advice. Past performance is not indicative of future results. Consult a qualified financial advisor before making investment decisions.
You May Also Like:
- The World’s Last Zero-Rate Anchor Is Rising, and Gold Should Care
- What Is a FOMC Meeting? What the Fed Decides and How Gold Reacts
- Gold in Your Phone: How Much Gold Is in Electronics and What It Means for Demand
- Real Yields vs. Nominal Rates: The Number That Actually Moves Gold
- How to Read a Gold Spot Price Chart: The 4 Things That Actually Matter
- Central Banks Hold 80% of Reserves in Gold. Sovereign Wealth Funds Hold Under 1%.
- You Don’t Need to Take Delivery to Sell Your Gold. Here’s What Actually Happens.
- The Real Price of a 1 Gram Gold Bar Isn’t $140
Popular Topics
Picked from the archive
-
01
 Topics
American Gold Buffalo Coin: Guide to the U.S. Mint’s Pure Gold
-
02
Topics
How Oil, PMI, and Newmont Are Driving Gold Prices
-
03
Topics
Why Gold Remains Resilient Amid the First Interest Rate Hike
-
04
Topics
Oil Up 7% Yesterday, Silver Down: Physical Buyers Pivot
-
05
Topics
Gold Rises $40 After 9-3 Fed Vote: Impact on Investors
-
06
Topics
FOMC Meeting Explained: How Fed Decisions Impact Gold
-
07
Topics
Major Banks Now Converge on 2026 Gold Price Near $4,500
-
08
Topics
Gold Price Forecast: Oil Futures Diverge From Stocks