Why Gold Should Watch the World’s Last Zero-Rate Anchor

Gold traded near $4,129.62 and silver near $61.16 on Monday, September 28, 2026, with both metals down sharply over the week. Gold slipped about 3.6% and silver roughly 4.9% from Friday’s close. Much of the market commentary has focused on familiar drivers: rising U.S. real yields, a stalled U.S.–Iran diplomatic track, and a repricing of Fed-hike odds. Those factors are real and important, and they’ve been covered in prior analysis.
But another, less-noted development several thousand miles away is also relevant to gold’s longer-term outlook.
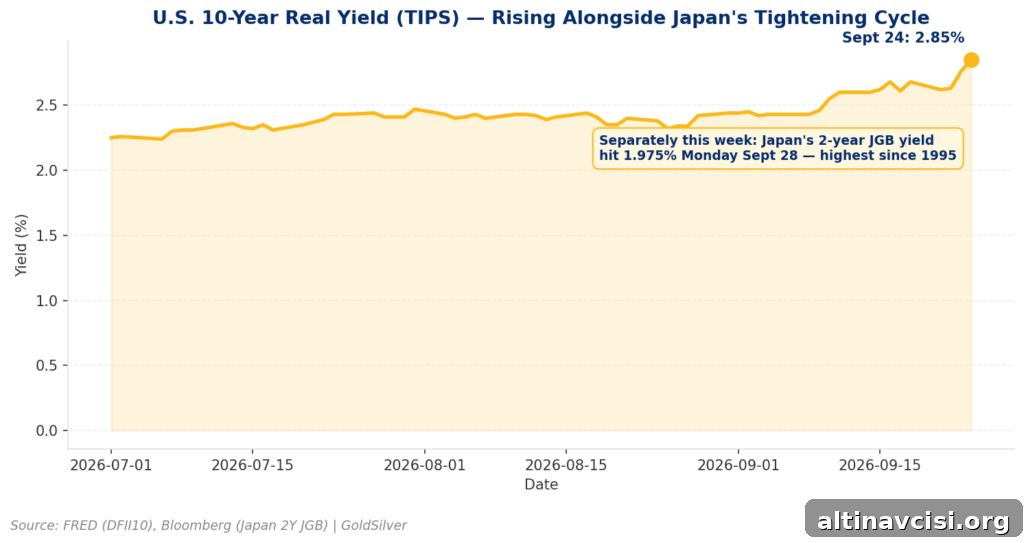
On Monday, Japan’s two-year government bond yield climbed to 1.975%, according to Bloomberg — its highest level since 1995. For most of the past three decades Japan offered savers near-zero yields on government debt. The market is now pricing not just a single adjustment but a continuation of the Bank of Japan’s tightening cycle. That shift matters for gold’s multi-year case more than a single weekly price move.
Key Takeaways:
- Japan’s 2-year government bond yield reached 1.975% on September 28, 2026, the highest since 1995, as markets price continued Bank of Japan rate hikes.
- This move is not just a reflection of the BOJ’s September rate decision (a 25 basis-point hike to 1.25% on September 18, 2026). It reflects the market pricing further tightening ahead.
- Gold’s real competitor is the global stock of “safe” sovereign debt. For the first time in this cycle, both U.S. and Japanese safe-yield markets are repricing higher simultaneously, changing the opportunity-cost math that shapes gold demand.
Why Is a Japanese Bond Yield a Gold Story?
Gold yields no coupon, dividend, or interest. Holding physical gold means forgoing the return available from risk-free government bonds — that forgone return is gold’s structural cost of ownership, often described as the opportunity cost. Over multi-year periods, gold’s price responds more consistently to changes in real (inflation-adjusted) yields than to headline nominal rates. When real yields climb, gold must offer a stronger case to compete with bonds; when real yields fall or turn negative, gold’s appeal increases.
A common mistake is to equate “risk-free yields” only with the U.S. 10-year Treasury. In reality, gold competes with the global stock of sovereign debt that investors regard as safe. For thirty years Japan supplied a substantial share of that safety at near-zero yields. Japanese pension funds, insurers, and retail savers had little incentive to seek higher-yielding government paper at home, and some capital instead flowed into foreign assets and into gold. That dynamic is now shifting.
The two-year Japanese government bond (JGB) is especially instructive. While the 10-year reflects longer-term growth and inflation expectations, the two-year is most sensitive to near-term central bank policy expectations. A rising two-year JGB signals the market expects more BOJ hikes sooner rather than later — and that expectation has implications for gold’s opportunity-cost calculation.
The Knowledge That Changes Everything

Two concise guides — free. Learn why gold matters and why fiat currencies can fail over time.
Subscribe for market updates and guides (form removed from this version).
Is This Just a Recap of the September Hike?
No. The Bank of Japan raised its policy rate from 1.00% to 1.25% on Friday, September 18, 2026 — a discrete policy decision. That announcement had only a limited immediate effect on gold. What’s different this week is the market-driven move in the two-year JGB to a 31-year high. A single policy action is a data point; a rising short-term yield across a major sovereign curve is a trend that shifts forward-looking expectations and alters the opportunity-cost math that governs gold over quarters and years.
What Does the Consensus Get Wrong About This Week’s Selloff?
The mainstream explanation treats the selloff largely as a U.S. story: real yields rose, Fed-cut odds declined, and gold fell. That is accurate in part. The U.S. 10‑year TIPS yield — the cleanest gauge of U.S. real rates — rose from 2.62% to 2.85% across three trading sessions, a 23 basis-point move. Historically, a move of that magnitude in real yields can push gold lower by roughly $40–$60 per ounce.
What that view misses is the simultaneity of repricing across the largest global safe-yield markets. Since gold’s post‑2008 bull trend began, Japan often supplied large amounts of nominally safe debt at near-zero yields. Now both U.S. and Japanese “safe” yields are moving higher concurrently, driven by related but distinct dynamics. That dual repricing tightens the global opportunity-cost environment for gold more meaningfully than a single-country move would.
The mechanics differ by country: Japan’s debt is overwhelmingly domestically held, giving the BOJ more scope to manage a transition without rapid foreign outflows, often at the expense of a weaker yen. The U.S., by contrast, depends on foreign creditors for a larger share of its financing, making equivalent moves potentially more destabilizing. Still, the common direction — less “free money” available to global savers — is what matters for gold.
What Does This Actually Test for Gold?
Gold’s long bull thesis — driven by monetary expansion, low real yields, and demand for non‑yielding safe assets — has not previously faced a sustained environment where both of its largest safe-bond alternatives are becoming more generous at once. If a roughly 2% two‑year JGB plus sub‑3% U.S. real yields still fail to outcompete gold for portfolio allocation after thirty years of near-zero Japanese yields, that would reveal a durable preference by investors to prioritize certainty of purchasing power and central-bank independence over a modest nominal return.
There is a plausible counterargument: rising JGB yields can strengthen the yen, which makes gold priced in yen more expensive and may reduce Japanese retail demand for the metal. That localized effect could partly offset the global tightening of opportunity cost. Both forces are real and can operate simultaneously; distinguishing which dominates will require observing trends over quarters rather than drawing conclusions from a single week.
Portfolio strategists have already proposed allocating to gold as a diversification tool amid changing bond dynamics. For example, a 60/20/20 approach (stocks/short-term bonds/gold) has been suggested where bonds no longer reliably diversify. Higher safe yields worldwide make that argument more complex, but the uncertainty of holding any single government’s paper through a tightening cycle remains a structural consideration.
What Should This Mean for Your Own Portfolio?
This development is not a signal to react to a single week’s price move. Instead, it’s a prompt to reassess what competes with gold in your asset mix: the global, shifting stock of paper that investors consider risk‑free. For decades Japan effectively subsidized the global safe-asset pool with near-zero yields; that subsidy is ending. The key questions are what replaces it and how much of a portfolio should be allocated to an asset that pays no yield but is unlinked to any central bank’s liabilities. Current headlines point to those structural questions even if most coverage focuses on shorter-term drivers.
Live U.S. dollar spot prices for gold and silver reflect global market dynamics and are updated in real time on price-tracking services.
Stay On Top of Gold & Silver Prices
Get important market alerts sent straight to your inbox.
Subscribe for news and alerts (subscription form removed).
People Also Asked
What is Japan’s 2-year government bond yield, and why does it matter for gold?
Japan’s two-year government bond (JGB) yield is the return investors receive for holding Japanese government debt for two years and is particularly sensitive to expected near-term central bank action. On September 28, 2026 it reached 1.975%, the highest since 1995. Because gold pays no yield, its attractiveness is measured against the real returns on safe sovereign debt. Rising short-term yields in Japan narrow gold’s relative appeal by increasing the opportunity cost of holding an asset that produces no income.
Is a rising Japanese bond yield different from a rising U.S. Treasury yield for gold’s price?
Both moves increase gold’s opportunity cost, but the underlying mechanics differ. Japan’s debt is held predominantly by domestic investors, so its central bank can more readily manage a tightening transition — often resulting in currency adjustments. The U.S. relies more on foreign creditors, so similar moves can carry different risks. What is notable now is that both markets are repricing higher at once, amplifying the global impact on gold.
How is the “opportunity cost” of holding gold actually calculated?
Opportunity cost compares the return you forgo by holding gold with the inflation-adjusted yield on comparable safe assets, typically government bonds. Empirically, moves of roughly 25 basis points in real yields have corresponded to $40–$60 per ounce shifts in gold on their own. The U.S. 10-year TIPS yield rose approximately 23 basis points over three sessions this week, which aligns with the historical relationship between real yields and gold price moves.
What is the risk to gold if Japan’s tightening cycle continues?
Sustained higher Japanese yields, added to already-elevated U.S. real yields, raise gold’s global opportunity cost and could exert downward pressure over time. Conversely, a stronger yen resulting from higher JGB yields could reduce domestic demand for gold as a currency hedge, since gold priced in yen becomes pricier. Both effects could operate simultaneously; determining which predominates requires watching trends across quarters.
Did the Bank of Japan’s rate hike in September 2026 already cause this week’s move?
No. The BOJ’s September 18 rate move from 1.00% to 1.25% was a single, anticipated decision that produced limited immediate reaction in gold. This week’s rise in the two‑year JGB reflects market expectations of continued tightening rather than the single past decision. That forward-looking repricing is the structural development that can alter gold’s longer-term opportunity-cost dynamics.
What happens to gold if both Japan and the U.S. keep raising real yields at the same time?
There is no definitive short-term answer. The scenario presents an unprecedented test for gold’s decade‑plus bull thesis. If investors continue to allocate to gold despite higher safe yields in both Japan and the U.S., that would indicate a durable preference for purchasing‑power certainty over modest nominal returns. Conversely, sustained higher yields could reduce gold’s share of portfolio allocations. Monitoring investor behavior over multiple quarters will reveal which outcome is likelier.
SOURCES
1. Bloomberg – Japan’s Two-Year Bond Yield Nears 2% as BOJ Rate Hike Bets Mount – September 28, 2026
2. FRED (Federal Reserve Economic Data) – 10-Year Treasury Inflation-Indexed Security, Constant Maturity (DFII10) – Observation Date September 24, 2026
3. GoldSilver – The Bank of Japan Just Hiked to a 31-Year High. Gold Barely Noticed. – September 18, 2026
4. The New York Times – Interesting Times with Ross Douthat, episode referencing Ray Dalio – May 7, 2026
5. Reuters / U.S. News & World Report – Morgan Stanley CIO Favors 60/20/20 Portfolio Strategy With Gold as Inflation Hedge – September 16, 2025
Disclaimer: This article is for informational purposes only and does not constitute investment advice. Past performance is not indicative of future results. Consult a qualified financial advisor before making investment decisions.
You May Also Like:
- What Is a FOMC Meeting? What the Fed Decides and How Gold Reacts
- Gold in Your Phone: How Much Gold Is in Electronics and What It Means for Demand
- Real Yields vs. Nominal Rates: The Number That Actually Moves Gold
- How to Read a Gold Spot Price Chart: The 4 Things That Actually Matter
- Central Banks Hold 80% of Reserves in Gold. Sovereign Wealth Funds Hold Under 1%.
- You Don’t Need to Take Delivery to Sell Your Gold. Here’s What Actually Happens.
- The Real Price of a 1 Gram Gold Bar Isn’t $140
- What Are Negative Real Interest Rates, and Why Does Gold Thrive in This Environment?
Popular Topics
Picked from the archive
-
01
 Topics
Weaker Dollar, Falling Gold: A Bullish Signal
-
02
Topics
Gold Drops 22% Like 2022: Why the Floor Is Different
-
03
Topics
Municipal Bonds Reach 15-Year Record: Why Gold Is Unaffected
-
04
Topics
Gold, Silver Steady as Bessent Seeks Hormuz Deal; JOLTS Falls
-
05
Topics
Gold Prices Pull Back Ahead of Fed Meeting
-
06
Topics
Will Policy Reversal Move Gold? Conflict Pressure Index Insight
-
07
Topics
Gold Falls to Two-Month Low as Yields Rise, Not Iran
-
08
Topics
Silver Price Outlook Sep 2026: Hike Priced In, Positioning Lags