Gold Outlook 2026: Banks Cut Targets Again as Price Falls Fast
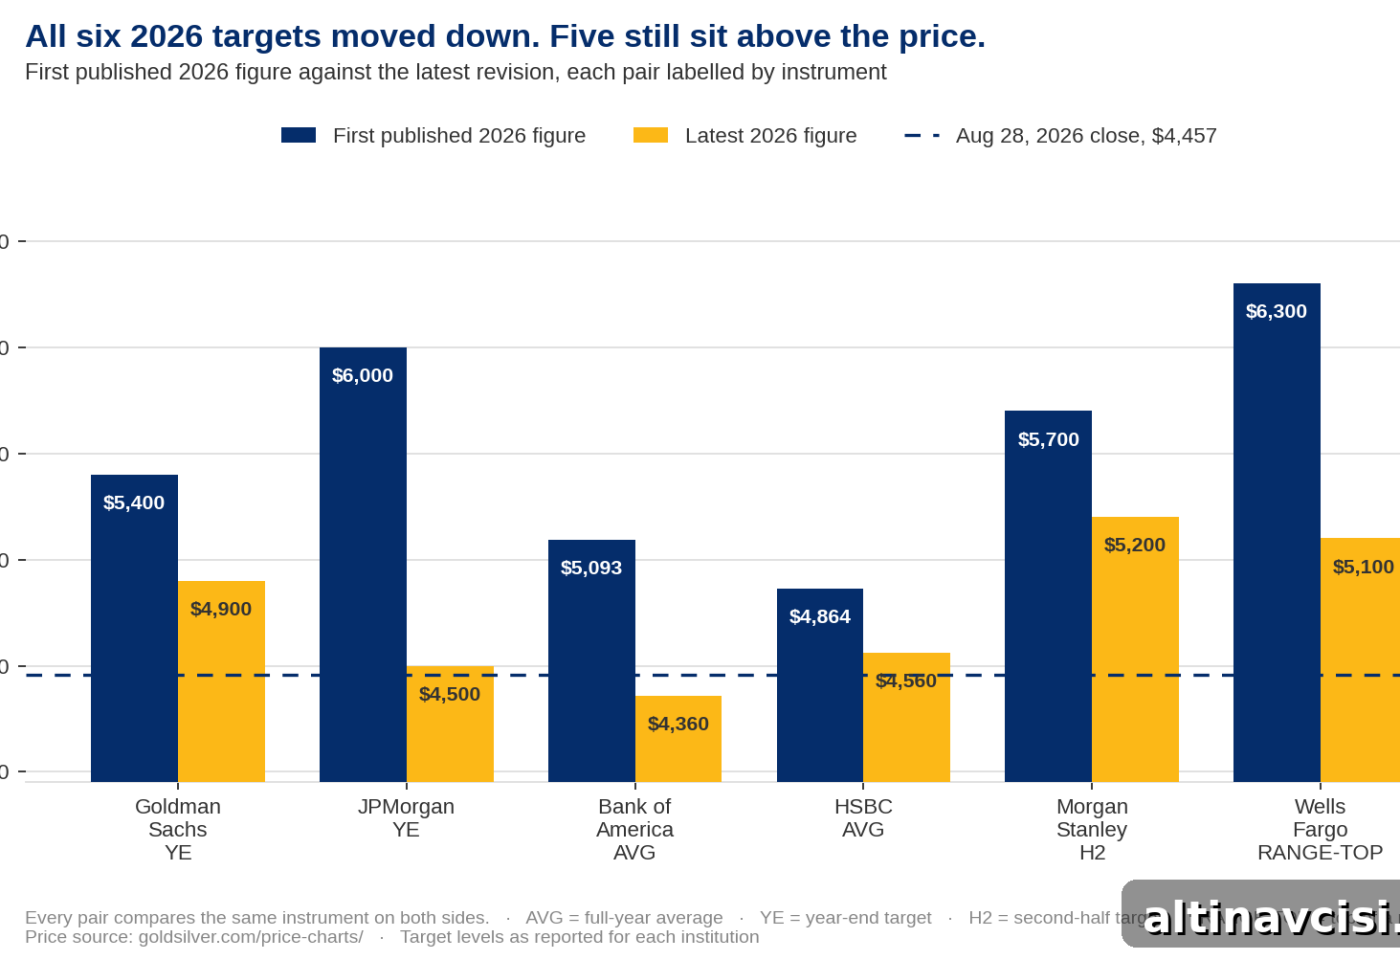
A bank price target is a dated projection of where an institution expects an asset to trade by a specified date. This year gold has slipped past several such forecasts twice — once over the summer and again in October.
Will the gold price fall in 2026? As of Tuesday, October 27, gold traded near $4,062 an ounce, up from a three-month low of about $3,996 reached on Friday, October 23 — its worst weekly close since June. Between June and August, six banks trimmed their year‑end 2026 figures. Two of those, Goldman Sachs and HSBC, cut their forecasts again in September and October. Every remaining year‑end or quarterly figure from that original group still sits above today’s price; in percentage terms, those gaps are now wider than they were in August.
Wells Fargo Investment Institute reduced its 2026 gold range to $4,900–$5,100 per ounce in the week of August 17, marking its third downgrade of the year. In February the same institute had estimated $6,100–$6,300, so the midpoint has declined by $1,200 an ounce since then. On September 29 Wells Fargo also trimmed its 2027 range to $5,200–$5,400 from $5,400–$5,600. Throughout the year gold itself has never travelled as far as many of these forecasts predicted, and the distance between the market and the targets has not closed.
Key Takeaways
- Gold closed at $4,062.07 on October 27, 2026, about 27% below the January 28 record of $5,589.38, after touching a three‑month low of $3,995.88 on October 23.
- Goldman Sachs reduced its year‑end target again on September 18 to $4,650 from $4,900. HSBC trimmed its 2026 average on October 1 to $4,490 from $4,560 and lowered its 2027 average to $4,825.
- Every comparable year‑end or quarter figure still standing — Goldman’s $4,650, HSBC’s $4,750 year‑end marker, JPMorgan’s $4,500 fourth‑quarter average, and Wells Fargo’s $4,900–$5,100 range — now sits roughly 11% to 26% above the market price, versus about 2% to 15% in late August.
- The macro backdrop shifted as rates moved: the Federal Reserve raised its benchmark rate on September 16 — its first hike since 2023 — and minutes from that meeting showed most officials expected another increase before year‑end. A further policy decision was scheduled for October 28.
- Official‑sector and fund buying continued. Central banks added 39 tonnes in August (the latest compiled month), and gold‑backed ETFs absorbed a record $31 billion in the third quarter, pushing global holdings to a record 4,256 tonnes.
That distinction between forecasts and market action matters now. Gold traded near $4,435 per ounce on Monday, August 31, 2026, roughly 21% below January’s record. The metal rose nearly 10% during August (measured from the July 31 close to the August 28 close) and gave back about 4.5% from its August 25 peak. Readers asking whether the decline will continue deserve an explanation of the mechanism behind moves, not another unanchored number.
What Happened to Wall Street’s Gold Price Targets Since Publication?
The first round of six revisions ran from June 19 (Goldman Sachs) to August 17 (Wells Fargo’s third cut). Two of those banks — Goldman Sachs and HSBC — revised again in September and October. The pattern was consistent: analysts adjusted forecasts as their assumptions about interest rates changed.
Goldman Sachs trimmed its year‑end 2026 target to $4,650 from $4,900 on September 18, following the Fed’s September decision; it kept its end‑2027 target at $5,400 and modeled one additional 2026 rate increase into that number.
HSBC cut its 2026 average to $4,490 from $4,560 on October 1 — a smaller adjustment than its July reduction — while saying gold “may be nearing a bottom” after further short‑term pressure. HSBC also lowered its 2027 average to $4,825 from $4,925 and kept its year‑end marker at $4,750.
A separate bank, not part of the original six, entered the field in October: CIBC set a fourth‑quarter 2026 figure of $4,500 on October 20, down from roughly $6,500 at the start of the year, while projecting a recovery to a $5,200 average in 2027.
What Did HSBC and Morgan Stanley Do?
HSBC cut its 2026 average to $4,560 from $4,864 on July 9, a $304 reduction, while maintaining its year‑end target near $4,750. The bank also published a $3,800–$4,700 range for the remainder of the year, implying it expected the metal to spend time near current levels before recovering.
Morgan Stanley took a different tack. On August 20 the bank noted that gold had already reached its fourth‑quarter forecast of $4,450 faster than expected and suggested a possible path above $5,000 in 2027. That was an upward shift for the longer view rather than a near‑term raise to the 2026 number.
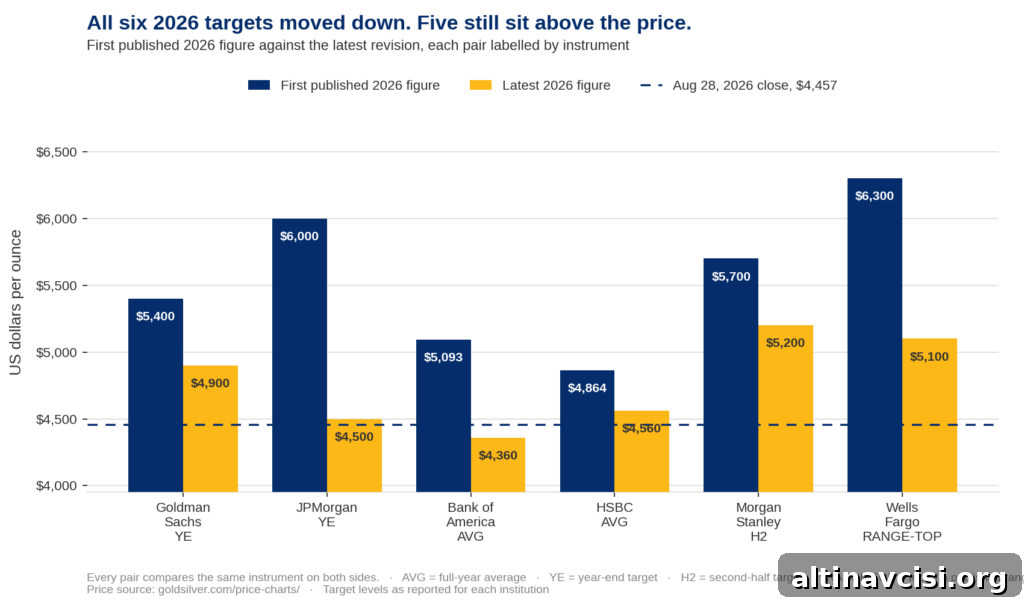
Which Banks Cut, and by How Much?
| Institution | First published 2026 figure | Latest 2026 figure |
|---|---|---|
| Goldman Sachs | $5,400 year-end target | $4,900 year-end target |
| JPMorgan | roughly $6,000 year-end target | $4,500 year-end target |
| Bank of America | $5,093 full-year average | $4,360 full-year average |
| HSBC | $4,864 full-year average | $4,490 full-year average |
| Morgan Stanley | $5,700 second-half target | $5,200 second-half target |
| Wells Fargo | $6,300 top of published range | $5,100 top of published range |
Why Did the Banks Cut Their 2026 Gold Forecasts — Twice?
The first round of cuts from June to August reflected a changing expectation for US interest rates. The autumn round followed when that interest‑rate path arrived: on September 16 the Federal Reserve raised its benchmark by a quarter point to 3.75%–4.00% — the first hike since 2023 — and minutes published on October 7 indicated most officials expected another increase before year‑end. Higher policy rates raise the opportunity cost of holding gold, which pays no interest, and a stronger dollar amplifies that effect for buyers using other currencies.
Analysts incorporated this revised rate outlook into their models. Goldman explicitly assumed one more 2026 hike when producing its $4,650 year‑end figure. HSBC pointed to rising yields and a firmer dollar and noted that speculative futures positioning on COMEX had been cut in September, which helped explain that month’s price decline. The banks did not discover a new, independent reason to cut gold forecasts in October; they updated their interest‑rate assumptions and adjusted the gold numbers accordingly.
The Knowledge That Changes Everything

Two essential guides — yours free. Understand why gold matters and why fiat currencies erode over time.
Will Gold Price Go Down in 2026? The Record Says Nobody Knows, and the Revisions Show Why
No analyst who publishes a target knows with certainty what gold will do next; the pattern of revisions is the practical evidence. Wells Fargo began 2026 with a $4,500–$4,700 range, raised that to $6,100–$6,300 in February, cut it to $5,300–$5,500 by mid‑June, and lowered it again to $4,900–$5,100 in August — a $1,200 swing in the midpoint within six months. Gold’s actual trading range during the same period moved less than the forecasted swings.
As of October 27, spot sits about 13% below Goldman’s reduced $4,650 year‑end target, around 16% below HSBC’s unchanged $4,750 marker, and 21–25% below Wells Fargo’s $4,900–$5,100 range. In August those gaps were closer to 2–15%. In short, prices moved faster and further than many of the cuts intended to reflect — twice this year. Historical drawdowns put a 27% retreat from a January record in perspective: it’s significant but not unprecedented across multi‑year holding periods.
What Were Central Banks and Funds Doing While Targets Fell?
They were buying. Central banks added 39 tonnes in August, and China continued its monthly buying streak through September. Gold‑backed ETFs recorded a historic $31 billion inflow in the third quarter, taking total global ETF holdings to a record 4,256 tonnes at the end of September, with European funds supplying a large share of the inflows.
Bank of America described fund positioning as a “fragile equilibrium” that could exacerbate declines if holders began to sell, but so far the data show funds and official buyers added exposure during the weakness. That distinction matters: an analyst’s forecast is an opinion; an allocation is capital at risk. Official and fund buying represents committed capital, not just commentary.
What Does a Second Round of Cuts Commit Anyone To?
Not much beyond a change in timing. HSBC preserved its year‑end marker while cutting two average forecasts; several banks still forecast higher 2027 levels than 2026. Revisions have slowed the expected pace of appreciation but have not altered the longer‑term direction embedded in those later forecasts. A price target is an unfunded opinion with no cost for being wrong; holders who committed capital earlier still carry that position through subsequent revisions. That asymmetry is why targets should not be the sole foundation of an investment plan — they tell you about sentiment, not about how to size or custody holdings.
What Does This Mean for Gold Investors Right Now?
Forecasts are the least durable input. Decisions you control — position size, form of ownership, and where and how you store metal — remain constant regardless of the next bank forecast. An ounce held in allocated, titled storage carries no revision history and no counterparty exposure; paper exposure may carry both. For metal held in retirement accounts, custody rules define allowable holdings before price questions arise. These structural choices matter more than the next published target or the Fed’s upcoming rate decision.
Stay On Top of Gold & Silver Prices
Get important market alerts sent straight to your inbox.
People Also Asked
No published bank currently targets a year‑end or fourth‑quarter level below where gold traded on October 27. Every remaining figure from the original six‑bank group, plus CIBC’s October estimate, sits above the October 27 price of $4,062.07 — a gap of roughly 11% to 26% depending on the bank. That doesn’t make a decline impossible; it simply means the published sell‑side consensus is not forecasting a further drop from that date.
Wells Fargo Investment Institute’s $4,900–$5,100 range, published August 17, is the highest remaining year‑end figure among the banks tracked here. The institute later trimmed its 2027 range but did not raise the 2026 range.
Most 2026 revisions trace back to one input: the expected path of US interest rates. The June–August round priced in a more stable or easing Fed; the September–October round priced in a Fed that raised rates on September 16 and signaled another possible hike. Forecasts are as much bets on policy as they are on the metal.
Not necessarily. Some banks cut near‑term averages while leaving year‑end markers unchanged or keeping higher longer‑term forecasts intact. A lower near‑term target paired with an unchanged or higher later figure typically signals a timing shift rather than a change in directional view.
Gold closed at $4,062.07 on October 27, 2026 — about 27% below its January 28, 2026 record of $5,589.38 — after touching a three‑month low of $3,995.88 on October 23.
Use targets as context, not instruction. Decide on position size, storage form, and account structure based on your objectives and risk tolerance. Those structural choices endure regardless of which bank publishes the next forecast.
SOURCES
1. Bloomberg — Goldman Sachs Lops $500 Off Gold Target on No Fed Cuts This Year, June 19, 2026.
2. BNN Bloomberg — BofA Cuts 2026 Average Gold Forecast, Sees Long‑Term Upside, July 8, 2026.
3. Reuters via MarketScreener — HSBC Lowers 2026–27 Gold Price Forecasts on Hawkish Fed Tilt, July 9, 2026.
4. TheStreet — Wells Fargo Revamps Gold Price Target for the Rest of 2026, August 2026.
5. Newsquawk — HSBC Cuts Its 2026 Average Gold Price Forecast to $4,490/oz, October 1, 2026.
6. InvestingLive — Goldman Trims End‑2026 Gold Forecast to $4,650 but Holds $5,400 Target for 2027, September 2026.
7. Kitco News — CIBC Slashes Gold Price Forecasts, Sees Recovery to $5,200 in 2027, October 20, 2026.
8. Federal Reserve — Minutes of the September 15–16, 2026 FOMC Meeting, released October 7, 2026.
9. World Gold Council — Central Bank Gold Statistics, August 2026, October 6, 2026.
Disclaimer: This article is for informational purposes only and does not constitute investment advice. Past performance is not indicative of future results. Always consult a qualified financial advisor before making investment decisions.
You May Also Like:
- SLV Holds Your Silver. It Just Can’t Give It Back to You.
- What Are the IRS Rules for a Precious Metals IRA in 2026?
- Why Your Pension Can Own Gold and Your 401(k) Still Can’t
- Central Bank Gold Custody: Where Nations Store Gold
- Permanent Portfolio: Harry Browne’s 25% Gold Rule
- Australian Gold Kangaroo: The Bullion Coin Backed by an Act of Parliament
- What Is Sound Money? Why the Dollar Lost Value Since 1971
- Vault Storage vs. Gold ETFs: Who Owns the Gold You Paid For?
- Silver Price Outlook August 2026: Down 47% and Barely Owned
Popular Topics
Picked from the archive
-
01
 Topics
Why Oil Is Surging While Gold Still Lags
-
02
Topics
172,000 Jobs Double Forecast: Thursday’s Report May Shift Gold
-
03
Topics
Fed Split on Rate Hike as 45% of Central Banks Buy Gold
-
04
Topics
Trump: US Only Semi-Negotiating With Iran, Gold Prices Rise
-
05
Topics
Purchasing Power Explained: How Inflation Erodes Your Savings
-
06
Topics
Why Silver Is Outperforming Gold After a Six-Year Slump
-
07
Topics
Gold Pullback Driven by Treasury Buyback, Not ETFs
-
08
Topics
Gold vs Bitcoin: Which Is the Smarter Investment Today?