Why Silver Is Outperforming Gold After a Six-Year Slump
Last verified August 2026.
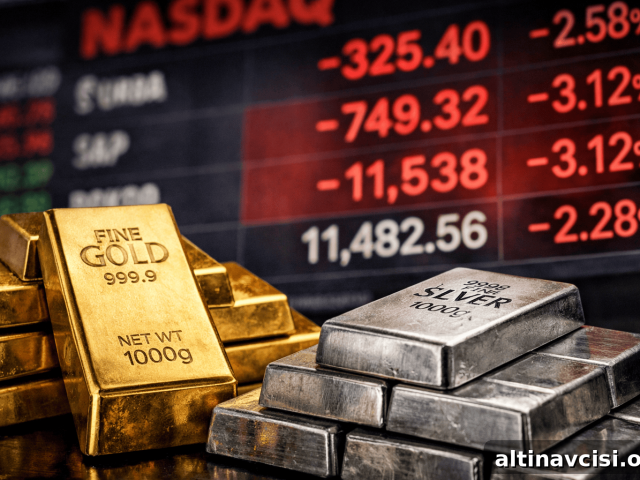
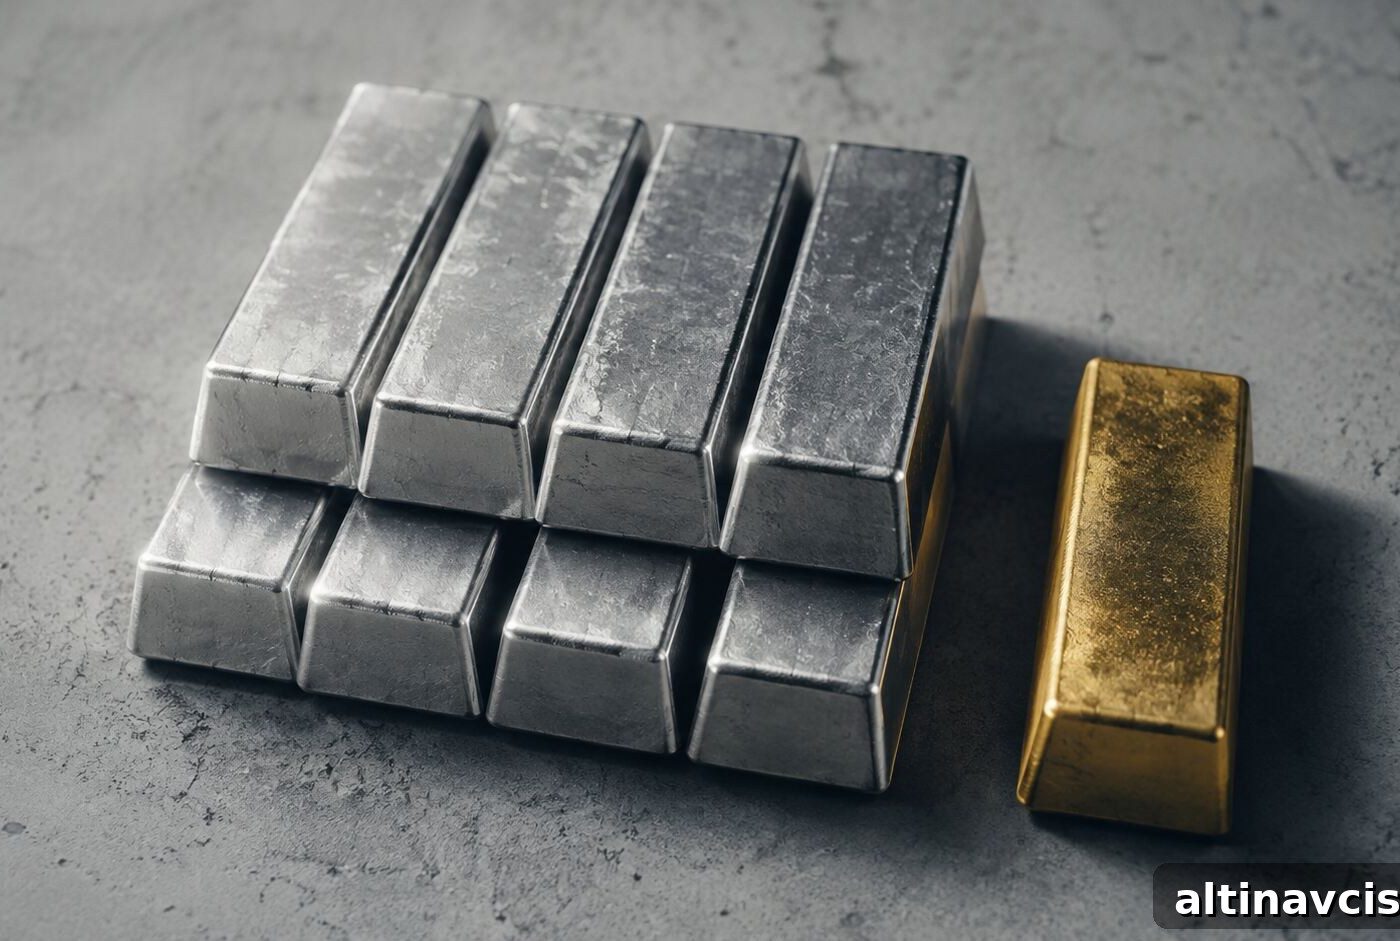
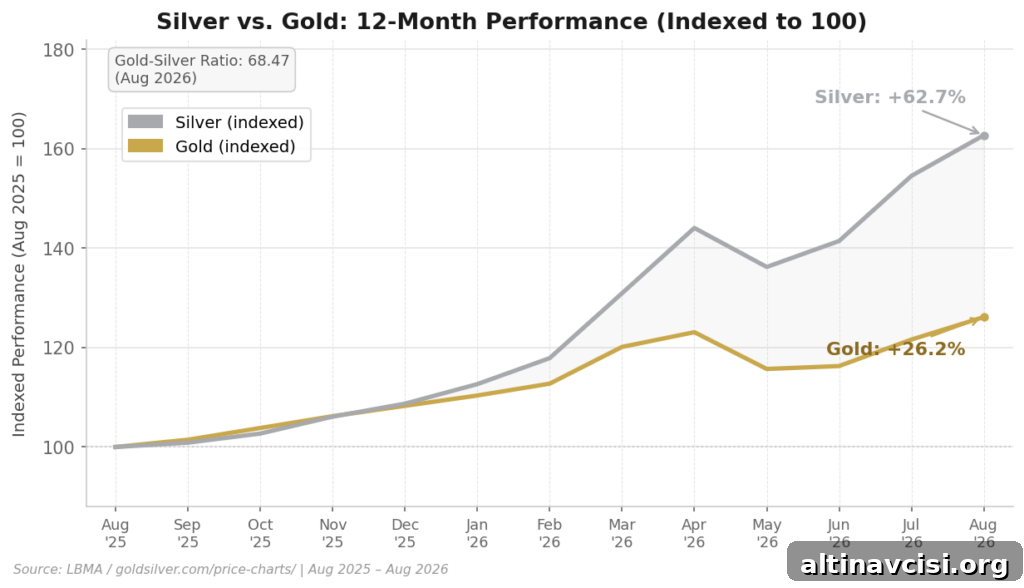
Silver is outpacing gold because a multi-year structural supply shortfall is colliding with rising industrial demand. That industrial demand was minimal a decade ago; today it is a major factor and the market is finally pricing in that shift. Over the past year, silver has risen 62.74% based on LBMA pricing, more than double gold’s 26.15% gain, despite gold receiving most of the headlines.
As of August 5, 2026, silver traded at $62.12 and gold at $4,253 per LBMA pricing. That divergence has driven the gold-silver ratio down to about 68.47, reflecting a meaningful change in the relationship between the two metals.
What’s Actually Driving Silver’s Supply Shortage?
According to the Silver Institute’s World Silver Survey 2026 (produced by Metals Focus), the global silver deficit in 2026 stands at roughly 46.3 million ounces. This marks the sixth consecutive annual shortfall. Since 2021, the cumulative deficit has reached approximately 762 million ounces. The persistent gap exists largely because most silver is produced as a byproduct of mining for other metals—primarily lead, zinc, and copper. That means higher silver prices alone cannot quickly create substantial new primary silver production the way they might for commodities mined for their own value. In practice, a copper company decides whether to expand copper mining, not to add silver supply, so price-driven increases in silver production are slow to appear.
What’s Pulling Industrial Demand Higher?
Industrial consumption reached 657.4 million ounces in 2025, representing about 58% of total global silver demand, per the Silver Institute’s 2026 data. Many of the sectors driving this demand were not significant consumers a decade ago. Electric vehicle (EV) manufacturers now use silver for battery contacts and charging infrastructure. AI data centers incorporate silver into cooling systems, circuit boards and certain conductive components. Solar panel manufacturing remains a steady source of demand, and long-standing electronics and industrial applications continue to draw silver because few materials match silver’s electrical conductivity. Physical trade flows also confirm this shift: China recorded a quarterly import record of roughly 1,626 tonnes in early 2026, reversing a historically export-heavy pattern, while India’s imports fell sharply after its import duty rose from 6% to 15%.
Why Does the Gold‑Silver Ratio Matter Right Now?
The gold-silver ratio indicates how many ounces of silver are required to buy one ounce of gold. With the ratio near 68.47 in August 2026, it shows silver gaining relative value. Silver benefits from two demand engines—monetary and industrial—while gold is driven primarily by monetary demand. When both monetary buyers and industrial consumers push on silver simultaneously, the ratio compresses. The current ratio suggests that compression is already underway and that silver is being revalued relative to gold.
What Do Wall Street’s Silver Forecasts Say?
Major financial institutions present a wide range of year-end silver targets, reflecting varying views on how structural the demand story is. Among prominent forecasts: Goldman Sachs projected $85–$100 (H1 2026 commodities research), HSBC expected an average of $75 (May 2026), UBS set a $70 target (July 31, 2026), Commerzbank targeted $67 (July 28, 2026), J.P. Morgan revised its outlook to $60–$65 (July 3, 2026), and Bank of America saw silver averaging $86 for the year (May 1, 2026). Even the more conservative estimates imply that silver could retain most of this year’s gains, depending on how durable analysts believe industrial demand will prove.
Why Does This Matter Beyond the Price Chart?
This market shift is not primarily driven by central bank announcements or geopolitical headlines. In 2026, real yields remain historically elevated rather than falling, which breaks the textbook scenario where lower real rates alone drive precious metals higher. Instead, a persistent physical shortage—six straight years where consumption exceeded mine supply—is changing the market. For savers and investors, that distinction matters: rallies driven solely by interest-rate moves can reverse quickly if policy changes, whereas a genuine physical shortage of a critical industrial metal must be resolved by tighter markets and higher prices for the metal itself. That logic also supports arguments for holding physical precious metals rather than instruments that represent claims on them, since the goal for many is preserving purchasing power through assets with intrinsic, industrial, and monetary utility.
Common Questions About Silver’s Rally
Why is silver outperforming gold in 2026?
A persistent supply deficit—46.3 million ounces in 2026, the sixth straight annual shortfall—is meeting growing industrial demand that now accounts for about 58% of total use. That combination is compressing the gold-silver ratio to roughly 68.47.
How do silver’s and gold’s yearly gains compare?
Over the past year, silver rose about 62.74% versus gold’s 26.15%, based on LBMA pricing as of August 5, 2026. That placed silver around $62.12 per ounce and gold near $4,253 per ounce.
How is the gold‑silver ratio calculated?
Divide the gold price by the silver price. For example, $4,253 divided by $62.12 equals approximately 68.47, meaning about 68 ounces of silver per ounce of gold.
Is falling interest rates driving silver’s rally?
No. In 2026, real yields are relatively high, so the rally is not the typical rate-driven precious-metals move. The primary driver is physical scarcity meeting increasing industrial demand.
Which sectors are pushing industrial demand?
Electric vehicles, AI data centers, solar-energy manufacturing, and traditional electronics are key drivers. These sectors need silver for its unmatched electrical conductivity in certain applications.
What happens if the supply deficit continues?
If deficits persist beyond the six consecutive years already recorded (a cumulative shortfall of roughly 762 million ounces since 2021), above-ground stocks that bridge the gap between mining output and consumption would be further depleted, intensifying price pressure unless primary production or recycling rises significantly.
SOURCES
1. LBMA — Silver & Gold Daily Prices, August 5, 2026 (LBMA pricing)
2. Silver Institute — World Silver Survey 2026, May 2026 (Metals Focus)
3. Metals Focus — World Silver Survey 2026, May 2026
4. Goldman Sachs — Commodities Research, H1 2026
5. HSBC — 2026 Silver Price Forecast, May 2026
6. UBS — Commodities Research, July 31, 2026
7. Commerzbank — Commodity Research, July 28, 2026
8. J.P. Morgan Global Research — Silver outlook, July 3, 2026
9. Bank of America — Silver Price Forecast 2026, May 1, 2026
Disclaimer: This article is for informational purposes only and does not constitute investment advice. Past performance is not indicative of future results. Always consult a qualified financial advisor before making investment decisions.
You May Also Like:
- Hormuz. ISM. Hecla. Barrick. Five Things That Moved Gold and Silver Today.
- Jobs Missed. Gold Hit $4,200. Silver Hit $62.
- South Korea’s Central Bank Ends a 13‑Year Pause and Buys Gold.
- Gold and Silver Hold as a Hormuz Deal Is Promised and Market News Evolves.
- Why Gold Is Holding Near $4,067 Ahead of a Jobs Week That Could Trigger a Rate Hike.
- Manufacturing Hits a Four‑Year High — Why Gold Didn’t Move Much.
- Gold Is Caught Between a Structural Bull Case and a Policy Ceiling.
Popular Topics
Picked from the archive
-
01
 Topics
Why Investors Are Buying Gold After Today’s Price Drop
-
02
Topics
5 Signs Gold’s Rally Is Gaining Momentum
-
03
Topics
Dollar Devalued 87% Since 1971: Why Central Banks Buy Gold
-
04
Topics
Why Global Silver Demand Exceeds Mining Supply
-
05
Topics
India Gold Import Duty Hike: Impact on Demand
-
06
Topics
Gold Price Tops $5,200, Silver $90 as Inflation Persists
-
07
Topics
How Gold and Silver Perform During Stagflation
-
08
Topics
Why $4,454 Gold Means the Fed Is Trapped