172,000 Jobs Double Forecast: Thursday’s Report May Shift Gold
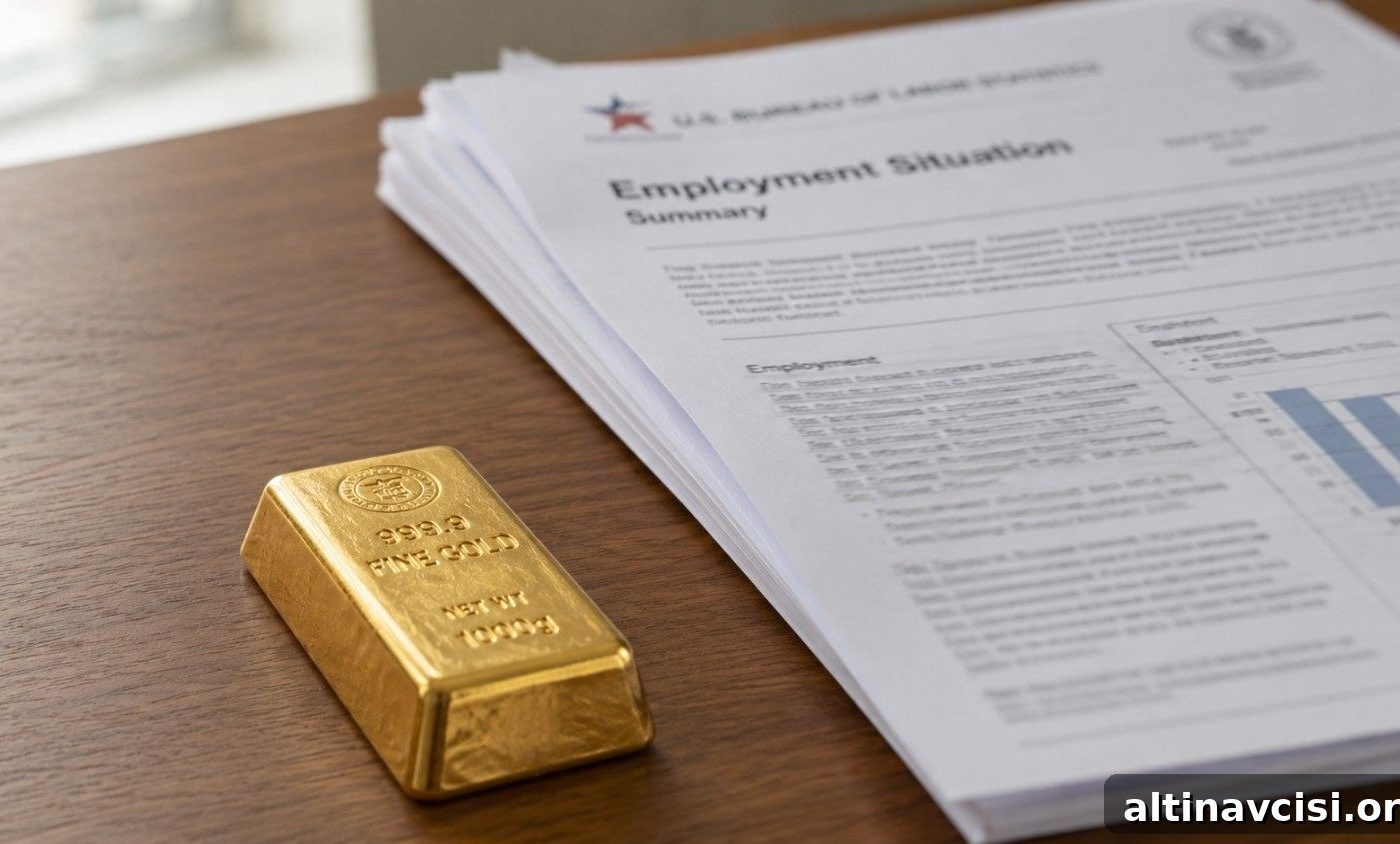
A stronger-than-expected jobs report pushed paper gold lower. The chain of events is straightforward: robust hiring keeps the Federal Reserve on a hawkish path, higher interest rates raise the opportunity cost of holding non‑yielding gold, and leveraged futures traders often sell quickly, amplifying the move. Traders have already started to react — gold is trading about $60 lower today ahead of Thursday’s release.
In May the Bureau of Labor Statistics reported 172,000 jobs added, roughly double the consensus forecast. Revisions to prior months made the string of data even stronger: March was revised to 214,000 and April to 179,000. Taken together, those three months averaged 188,000 jobs added — the strongest three‑month stretch in more than two years, according to market analysis. Markets responded immediately: Treasury yields rose, the dollar strengthened, the Nasdaq fell sharply, and gold slipped as investors priced greater odds of additional Fed tightening.
Thursday’s June jobs report is being released a day early because of the Independence Day holiday. The Street consensus in week‑ahead surveys is around 115,000 payrolls added. That forecast is below May’s pace but still high enough to keep the Fed on its current course unless the report surprises to the downside. Below I outline what different outcomes likely mean for the gold price and interest‑rate expectations.
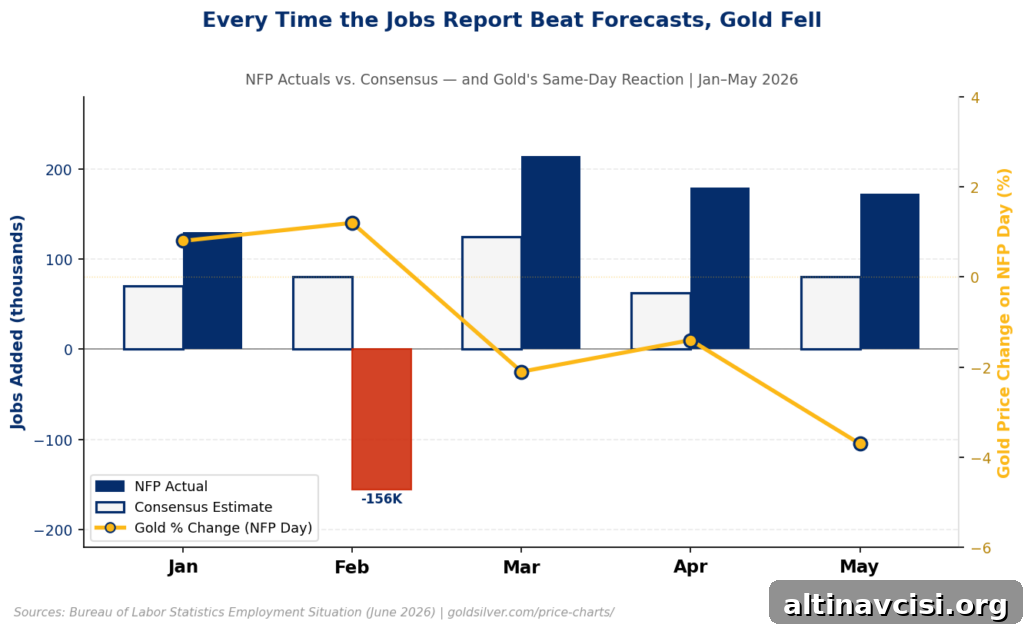
What each jobs outcome means for gold
Scenario 1 — Strong beat (150,000+): A clear beat would likely push gold lower on the session. A stronger payroll print would lift the dollar and increase the market’s expectations for further Fed hikes in July and September. Trading tools such as CME FedWatch would likely move to price higher odds of additional rate action, and many bank forecasts that already include multiple hikes this year would be reinforced.
Scenario 2 — In line (~100–130,000): If payrolls print close to consensus, price moves for gold should be limited. The market would remain data dependent, with focus shifting to other near‑term events such as international diplomatic developments and central bank speeches for the next directional clue.
Scenario 3 — Soft miss (below 100,000): A weaker report would be the most bullish near‑term outcome for gold. A soft payroll number gives the Fed more room to pause on rate hikes, compresses the odds of another increase this year, and tends to weaken the dollar. That combination typically allows gold to recover. Many market participants remain biased for strength after several consecutive upside surprises in payrolls, so a downside surprise could trigger a meaningful short‑covering bounce.
Why average hourly earnings matter more than the headline payroll number
The headlining jobs figure grabs headlines, but what really moves real yields — and therefore gold — is wage growth and its impact on inflation expectations. When market interest rates rise above inflation, holding a non‑yielding asset like gold becomes less attractive because savers can earn yield elsewhere.
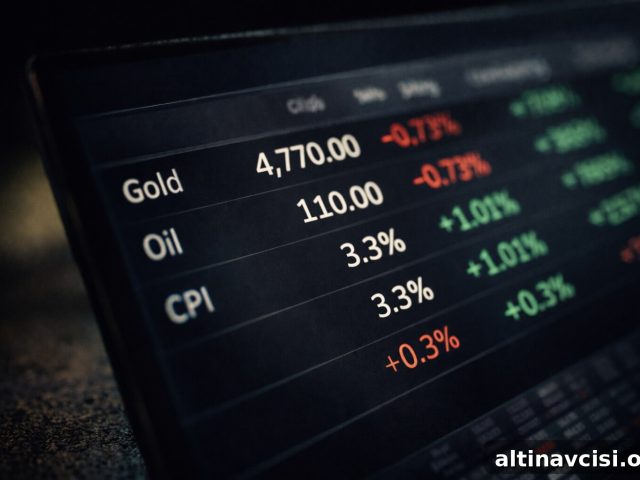
Average hourly earnings, reported with the jobs data, give a clearer read on wage pressure. In May, wages rose 3.4% year‑over‑year according to the Bureau of Labor Statistics, while the personal consumption expenditures (PCE) price index — the Fed’s preferred inflation gauge — ran about 4.1% over the same period. That combination implies real average hourly earnings fell roughly 0.7% year‑over‑year in May: nominal wages increased but did not keep pace with inflation. This dynamic — rising nominal pay that nonetheless loses purchasing power — is a structural feature that rate hikes alone cannot fully correct.
The Federal Reserve can raise rates to slow demand, but higher rates also increase the government’s interest burden on a large national debt. Each rate hike raises interest costs on outstanding debt, which creates fiscal trade‑offs that central banks and markets must weigh over time.
What to watch Thursday at 8:30 AM ET
Three data points will likely move gold and rate markets when the report hits:
- The headline payroll figure — the deviation from consensus (~115,000) matters more than the absolute number for immediate market reaction.
- Average hourly earnings — a monthly print above roughly 0.3% would rekindle inflation fears and push rate expectations higher.
- The unemployment rate — expected to hold near recent levels; any noticeable uptick would reduce the odds of further hikes faster than payrolls alone.
Gold’s paper price typically reacts within minutes of the 8:30 AM ET release as traders repriced rate odds. The jobs report is a real‑time indicator of what rate traders expect next, while long‑term buyers of physical gold — including some official sector buyers — position for how those cycles eventually unfold.
Stay on Top of Gold & Silver Prices
Sign up for market alerts and price updates delivered to your inbox.
Receive timely updates about gold and silver prices, major economic releases, and events that affect precious metals markets.
SOURCES
1. Bureau of Labor Statistics — The Employment Situation, May 2026
2. Bureau of Labor Statistics — Current Employment Statistics (June 2026 release schedule)
3. CME FedWatch — FOMC rate probabilities, late June 2026
4. Newsquawk — Week Ahead Highlights, late June 2026
5. IG Markets — Weekly market commentary, June 29, 2026
6. US Treasury Fiscal Data — Debt to the Penny (debt figures as of June 2026)
7. Gold and silver live price data and historical charts
Disclaimer: This article is for informational purposes only and does not constitute financial or investment advice. Consult a qualified financial adviser before making investment decisions.
You May Also Like:
- The Dot Plot Has 18 Dots. The Chair Withheld His.
- Gold’s Worst Week of 2026. Central Banks Just Filed a Record Buy Signal.
- Silver Looks Like It’s Losing. The Ratio Says It’s Loading.
- Q1 GDP Beat. Jobless Claims Beat. Gold Rose. Here’s Why.
- PCE Hit 4.1%. Gold Went Up. Here’s Why.
- 298 Tonnes of ETF Gold Is Underwater. Central Banks Aren’t.
- Hawkish Fed, Gold Below $4,000, Silver Below $60 — and a Market That Disagrees.
Popular Topics
Picked from the archive
-
01
 Topics
Warsh Says Inflation Too High but Risk Is Fading, Gold Reacts
-
02
Topics
Gold Price Falls to $4,681 as Iran Ceasefire Ends Today
-
03
Topics
Gold Falls After U.S. Wholesale Prices Surge
-
04
Topics
Factory Cost Index Hits 82.1: Why It’s Driving Gold Prices
-
05
Topics
Gold Steadies After 1.8% Drop as Tariffs Raise Inflation Worries
-
06
Topics
February 2026 CPI Report: Inflation Calm Before Oil Shock
-
07
Topics
Why Silver Dropped 3.3% vs Gold’s 1.6%: The Gap Explained
-
08
Topics
CPI 3.3% and GDP Stalling: Is 2026 Stagflation Coming?