US Debt Tops 40 Trillion as Jefferies Goes Bullish on Gold

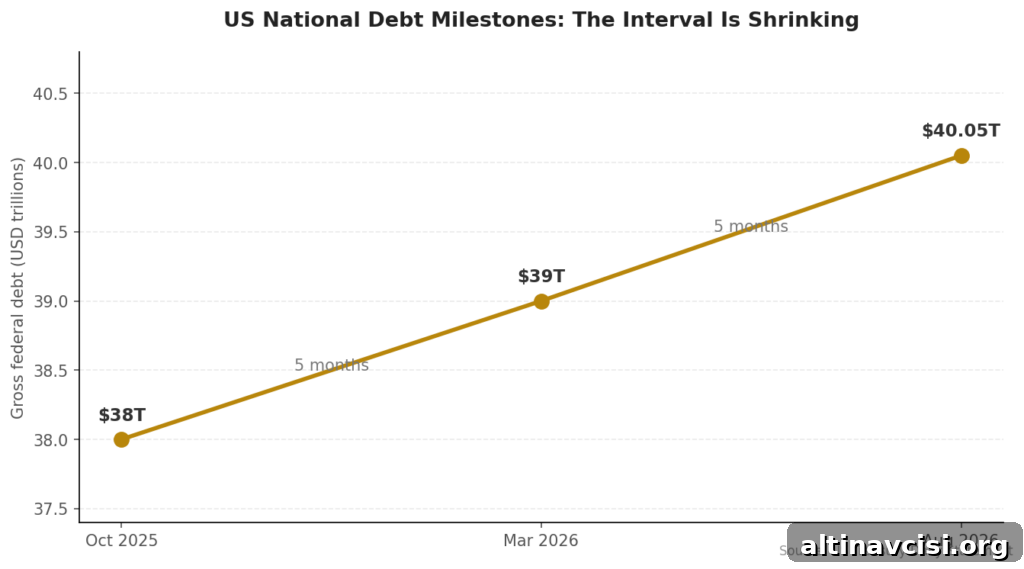
America’s national debt crossed the $40 trillion mark on Tuesday, August 18 — a rapid climb that followed $39 trillion just five months earlier and $38 trillion five months before that. That accelerating pace has market strategists revisiting the role of gold as a fiscal hedge. Within days of the milestone, a widely read Jefferies strategy note turned notably more bullish on gold.
As of Friday morning, gold is trading around $4,581.95 per ounce, up roughly 1.4% and sitting near its highest level since early June. Silver has rallied to about $69.43, gaining nearly 2%, after an overnight high near $70. The gold-silver ratio is close to its long-term average, around 66:1, reflecting a historically typical relationship between the two metals.

The Edge Every Investor Needs
Smarter precious metals investing starts here. The Nuggets Newsletter delivers market insights, Fed updates, global trends, and educational resources.
What Did Jefferies Say About Gold?
In its weekly GREED & Fear strategy note, Chris Wood and his team at Jefferies shifted to a more bullish stance on gold. The bank highlighted three main drivers: weakening public finances in the United States and Japan, reduced policy flexibility for central banks, and stronger free-cash-flow generation at gold mining companies.
Jefferies pointed to recent U.S. fiscal data to illustrate the point. Treasury figures showed a $432 billion federal deficit for July — the largest monthly shortfall since March 2021 and a record for any July. Over the first ten months of fiscal 2026 the deficit reached $1.799 trillion versus $1.775 trillion for all twelve months of fiscal 2025. That comparison signals a clear acceleration, though it comes with an important accounting note.
Because August 1 fell on a Saturday, about $99 billion in payments scheduled for August landed in July’s accounting; Treasury’s adjusted ten-month total is therefore $1.700 trillion. The takeaway is not a single headline number but the trend: deficits are large and widening, which narrows policymakers’ long-term options.
How Does the National Debt Affect the Gold Price?
The connection between rising national debt and the gold price runs mainly through the Treasury market and interest rates, not directly through current inflation readings. More debt means more bond issuance; greater supply of government securities tends to push yields higher when demand does not keep pace. In this episode the 30-year Treasury yield climbed to its highest level in roughly 19 years, prompting the Treasury Department to increase the maximum size of buyback operations from $2 billion to at least $4 billion per purchase.
That move temporarily pressured yields, but the decline quickly reversed and long-term rates returned to prior levels. Higher yields increase the government’s interest bill: interest payments already accounted for about 18.5% of federal revenues in fiscal 2025, the largest share on record for the series, and the Congressional Budget Office expects a similar share for fiscal 2026. If central banks try to defend a currency by pushing rates higher, they risk amplifying that interest burden — a fiscal constraint economists call fiscal dominance. Gold, in contrast, sits outside direct fiscal accounting and can act as a hedge against currency depreciation tied to these pressures.
Why Are Gold Miners Now Outearning the S&P 500?
One concrete and measurable change is the cash-flow yield profile of gold miners. The Philadelphia Stock Exchange Gold and Silver Index now yields about 3.74% on free cash flow, compared with roughly 2.67% for the S&P 500. That marks a significant reversal from mid-2023, when the gold and silver index was losing cash while broader equities generated returns. The shift came because the gold price rose faster than mining costs, boosting miners’ free cash flow. Even so, miners’ cash-flow yield fell from a peak near 5.07% at the end of July as share prices rose.
Is the Fiscal Case for Gold Actually New?
No — investors have linked national debt and currency risk to gold for decades. What has changed is the immediacy of the arithmetic: deficits and debt milestones are rising faster than many expected. Jefferies did not name gold its single best hedge; the note placed oil and energy equities ahead of gold, citing geopolitical vulnerabilities such as the Strait of Hormuz. Still, the bank’s emphasis on realized fiscal data rather than only on short-term rate forecasts signals a shift in thinking for some institutional investors. A bullish call from a major bank reflects sentiment, not a guaranteed price path.
What Does a $40 Trillion National Debt Mean for Savers?
The important point is pace: the debt took roughly two centuries to reach its first trillion, while each of the most recent trillions arrived in only a few months. As the stock of debt grows faster and interest compounds, policymakers face three broad choices: cut spending, raise taxes, or allow inflation to reduce the real value of liabilities. Historically, governments have often relied on inflation to ease debt burdens, which is why understanding sound money and currency risk remains relevant for long-term savers.
Gold does not predict which policy path officials will choose. Instead, it reflects the purchasing power of the currency in which liabilities are denominated. For many savers, holding some allocation to gold is a way to diversify exposure to policy and fiscal risks.
What Should You Watch Next?
Three developments matter for markets now. First, the Treasury’s larger buyback operations are scheduled to run from September 9 through November 4 — their effectiveness in stabilizing the long end of the curve will be watched closely. Second, Kevin Warsh is scheduled to give a Jackson Hole keynote on Friday, August 28; market participants will parse his remarks for signals about policy and inflation. Third, on the price side, watch the near-term resistance level around $4,604 for gold; clearing that area would be the next technical milestone.
Stay On Top of Gold & Silver Prices
Get important market alerts sent straight to your inbox.
SOURCES
1. ANI — Jefferies Turns Bullish on Gold as US, Japan Fiscal Strains Constrain Monetary Policy
2. US Joint Economic Committee — July Closes with $432 Billion Deficit, Largest Monthly Deficit Since March 2021
3. Peter G. Peterson Foundation — Monthly Interest Tracker and the Current Federal Deficit and Debt
4. CBS News — National Debt Tops $40 Trillion After Doubling in Less Than a Decade
5. Committee for a Responsible Federal Budget — Treasury Confirms $1.8 Trillion Deficit for First 10 Months of FY 2026
6. CNBC — Treasury Announces Upscaled Buyback Operation, and Yields Rebound the Following Session
7. Federal Reserve Bank of Kansas City — Jackson Hole Economic Policy Symposium 2026
8. Jefferies — Christopher Wood, Global Head of Equity Strategy
9. GoldSilver — Live Gold and Silver Price Charts
Disclaimer: This article is for informational purposes only and does not constitute investment advice. Past performance is not indicative of future results. Always consult a qualified financial advisor before making investment decisions.
You May Also Like:
- Gold Fell and Silver Rose on the Same Report. Here Is the Mechanism.
- Trump Declared Economic War on Iran. Gold Barely Blinked. Here’s Why.
- Gold’s Pullback Isn’t About ETFs. It’s About a Treasury Buyback.
- The Fed Just Confirmed a 9-3 Split. Then It Said Something Bigger.
- Gold and Silver Are Climbing Today. The Textbook Says They Shouldn’t Be.
- Gold Jumped 1.9%. Silver Jumped 2.7%. The Fed Hasn’t Said a Word Yet.
Popular Topics
Picked from the archive
-
01
 Topics
Gold Prices Stabilize Amid Saudi-Iran Tensions
-
02
Topics
Why Gold Held Steady After Trump’s Economic Pressure on Iran
-
03
Topics
Oil Drops 11% as Gold Rises: What Investors Need to Know
-
04
Topics
3 Questions Investors Must Ask Before Buying Any Asset in 2026
-
05
Topics
Silver Surges Past $70 Amid Conflicting GDP Data
-
06
Topics
What’s Moving Gold and Silver Prices This Week
-
07
Topics
How FOMC Minutes and Jackson Hole Could Move Gold
-
08
Topics
Two Investors Ran Debt Math Separately and Chose 15 Percent Gold