Long Bond Hits 19-Year High as Inflation Expectations Stall

Gold prices slipped 1.1% to about $4,369 an ounce by midday on Tuesday, August 18, 2026, even as the 30-year Treasury yield climbed to 5.33%, marking a 19-year high. The apparent contradiction is explained by movements in real yields: long-term borrowing costs rose while inflation expectations remained anchored near 2.3%, boosting the inflation-adjusted return on cash and government bonds.
Investors demanded more compensation to lend to the U.S. government for 30 years than at any time since 2007, while their forecast for inflation over the next decade barely changed. That mix—the rise in real yields with stable inflation expectations—is the key driver behind the move in metals and bond markets.
Silver saw a larger decline, down 2.7% to $64.00, which pushed the gold-silver ratio higher from 67.1 on Monday to about 68.3 on Tuesday.
What Happened in the Bond Market on Tuesday?
The 30-year Treasury yield reaching 5.33% was the highest level since 2007. Through the morning the yield traded near 5.32%. At the same time, 10-year notes yielded about 4.73% and two-year notes roughly 4.19%.
The immediate trigger was fiscal: the Treasury reported a large July deficit of $432.3 billion, the biggest single-month shortfall since March 2021. Roughly $99 billion of that total reflected August benefits paid early, but fiscal-year borrowing is already tracking near $1.8 trillion—above last year’s full-year issuance. The renewed rush into longer-term borrowing pushed global yields toward multi-decade highs.
Why Did Gold Fall While Treasury Yields Rose?
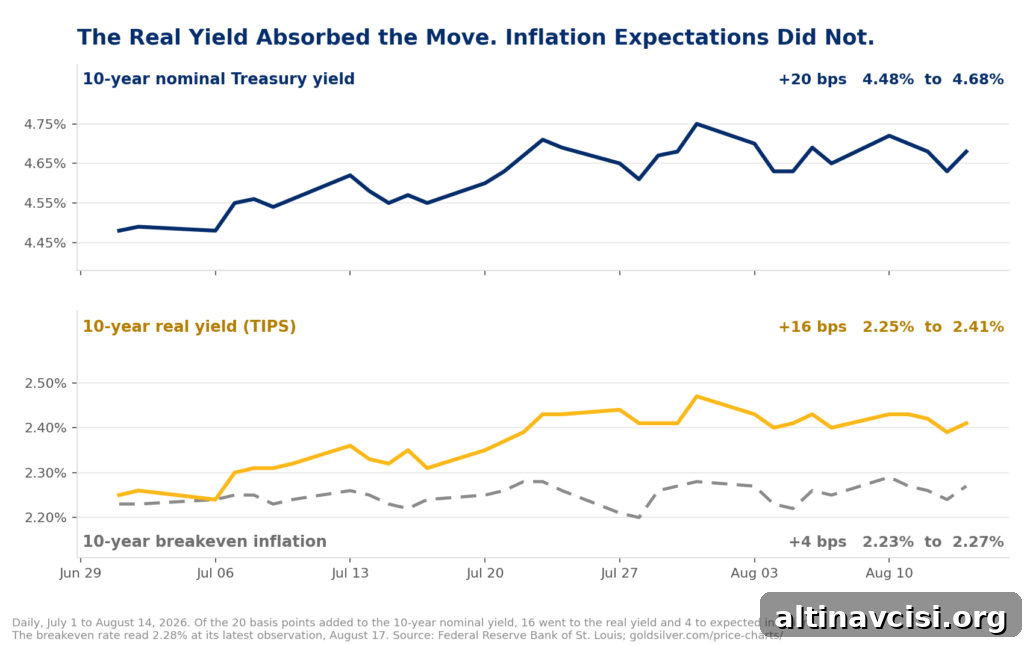
For gold, the yield that matters most is the real yield—the return on cash after adjusting for expected inflation—not the nominal yield. On August 17 the 10-year breakeven rate, the bond market’s measure of expected inflation over the next decade, sat at about 2.28%, essentially unchanged for the week. By contrast, the 10-year real yield, derived from inflation-protected Treasuries, was roughly 2.41% on August 14.
Since July 1 the 10-year nominal yield rose by about 20 basis points, from 4.48% to 4.68%. Breakeven inflation accounted for only about 4 basis points of that move; the remaining roughly 16 basis points showed up in the real yield, which rose from 2.25% to 2.41%. That increase in real yields creates opportunity cost for holding gold, which pays no yield.
Historical analysis shows this relationship matters. For example, regressions of gold returns against real yields indicate that a 100-basis-point rise in real yields typically corresponds with a substantial decline in gold’s inflation-adjusted price. Industry watchers often point to levels near 2.5% real yield as a threshold where the carry advantage of cash and inflation-protected bonds begins to outweigh the non-yield benefits of gold; current readings sit only modestly below that mark.
Is This an Inflation Story or a Credit Story?
This episode looks more like a credit story than an inflation one, and the distinction matters for how markets behave going forward. Economists refer to the extra compensation investors require for holding long-term bonds as the term premium. It reflects duration risk, supply risk, and the chance that the borrower’s finances deteriorate over time. Term premium is not an inflation forecast—the breakeven inflation rate is.
Recent economic data show soft demand and cooling price pressures: July retail sales fell 0.6% and producer prices were essentially flat. Typically, softer demand and subdued inflation would push yields lower. Instead, yields rose, suggesting the bond market is repricing the credit risk and supply outlook for Treasury issuance rather than revising long-run inflation expectations.
What Are the Fed and Wall Street Saying About Real Rates?
Federal Reserve officials have acknowledged tighter financial conditions driven in part by higher nominal and real rates. In July the Fed emphasized that those tighter conditions could justify holding policy steady rather than hiking further. At that meeting the policy rate range remained at 3.50% to 3.75%.
Market strategists are watching the long-end closely: some technical analysts suggest long-term yields could test the 5.60%–5.70% area if current momentum continues, which would extend the real-yield headwind for precious metals unless inflation expectations rise in parallel.
What Does the Bear Case Get Right?
The bearish argument for gold is straightforward and persuasive on its face. At a real yield near 2.41%, cash and inflation-protected bonds deliver a positive real return that gold does not. If breakeven inflation remains around 2.3% while nominal yields—and therefore real yields—keep climbing, that will continue to pressure gold prices.
However, that view captures direction more than cause. Rising real yields can reflect higher policy rates or stronger real growth, but they can also reflect fiscal strain: heavier government borrowing raises term premia and creates long-term risks to the purchasing power of the dollar. Those same fiscal dynamics are part of the argument for holding gold as a non‑promissory store of value.
What Does a 19-Year-High Long Bond Mean Over Five Years?
The fiscal math that helps push real yields higher today also undermines the long-term case for bonds as a store of value. Net interest on the federal debt has climbed sharply and is projected to exceed $1 trillion, meaning interest payments are taking a growing share of federal revenues. Higher yields increase the cost of rolling debt, widening deficits and requiring more borrowing—an effect that can raise term premia further.
Put differently: Treasury securities represent a promise to pay dollars, and rising real yields make that promise more attractive right now. But the fiscal and supply forces driving those yields can erode the value of that promise over a decade, which is precisely why some central banks continue to buy gold even when prices temporarily dip.
What Should You Watch Next?
Focus on the spread between nominal yields and inflation expectations—the real yield—rather than the headline nominal rate alone. Key near-term data include the minutes from the July Federal Open Market Committee meeting and any signals about renewed debate over further hikes. If the 30-year Treasury keeps climbing while breakeven inflation stays near 2.3%, real yields will continue to rise and put pressure on precious metals. If breakeven inflation moves higher and narrows the gap, the rise in real yields could stall.
Market participants should also watch fiscal reports and monthly Treasury statements for signs of how much additional issuance the Treasury will need. The next Fed policy decision is scheduled for September 16, and any shifts in forecasts or rhetoric between now and then could move both breakevens and long-term yields.
Stay On Top of Gold & Silver Prices
Get important market alerts sent straight to your inbox.

SOURCES
1. CNBC — reporting on the 30-year Treasury yield reaching a 19-year high and related coverage of yields and fiscal concerns.
2. Federal Reserve Bank of St. Louis — series on 10-year breakeven inflation and inflation-protected securities.
3. PIMCO — analysis on the historical relationship between real yields and gold prices.
4. World Gold Council — research on gold demand trends and central bank purchases.
5. Peter G. Peterson Foundation and Committee for a Responsible Federal Budget — analysis of net interest on the federal debt and projections for interest costs.
6. U.S. Department of the Treasury — monthly Treasury statements and fiscal data.
7. Spot price data for gold and silver as reported by market price services.
Disclaimer: This article is for informational purposes only and does not constitute investment advice. Past performance is not indicative of future results. Always consult a qualified financial advisor before making investment decisions.
You May Also Like:
- FOMC Minutes Tomorrow. Jackson Hole in Nine Days. Here Is What Gold Needs From Both.
- Three Fed Officials Voted to Hike. What It Means for Gold.
- Why Is Gold Not Going Up? The Bears Vanished in June.
- JP Morgan Just Flagged a Silver Demand Warning. Silver Rose Anyway. Here Is Why.
- Gold Needed One Thing to Break $4,400. It Just Got Five of Them.
- Zero Tankers Crossed Hormuz on Sunday. Oil Hit $89. Gold Barely Moved.
Popular Topics
Picked from the archive
-
01
 Topics
Gold Prices Stabilize Amid Saudi-Iran Tensions
-
02
Topics
Why Gold Held Steady After Trump’s Economic Pressure on Iran
-
03
Topics
Oil Drops 11% as Gold Rises: What Investors Need to Know
-
04
Topics
3 Questions Investors Must Ask Before Buying Any Asset in 2026
-
05
Topics
Silver Surges Past $70 Amid Conflicting GDP Data
-
06
Topics
What’s Moving Gold and Silver Prices This Week
-
07
Topics
How FOMC Minutes and Jackson Hole Could Move Gold
-
08
Topics
Two Investors Ran Debt Math Separately and Chose 15 Percent Gold