Gold Jumps to Two-Week High as Three Market Forces Converge

Gold is trading near $4,130 this morning, its highest level in two weeks, after advancing more than 1% since Tuesday’s close. The rise isn’t random — three distinct forces converged on Wednesday, and each played a clear role in lifting the price.
To appreciate why the combination matters more than any single factor, it helps to understand how gold prices behave when multiple catalysts act simultaneously.
Source: goldsilver.com/price-charts/ · Price as of ~9:17 AM ET
Why Did Iran Strikes Push Gold Higher Today?
The U.S. military carried out its 11th consecutive night of strikes against Iranian targets early Wednesday, according to official CENTCOM reporting. The strikes focused on military operations centers, aircraft hangars, drone storage facilities and maritime infrastructure near the Strait of Hormuz. Iran responded with attacks on sites tied to U.S. interests in Kuwait, Jordan and Bahrain.
The regional conflict began on February 28, 2026, and while it is not new, recent escalation matters for markets. Traders had partially priced in a de-escalation after a mid-June ceasefire, but renewed attacks and public statements have made that outcome less certain. Each fresh round of strikes ratchets up geopolitical risk and undermines the assumption that the situation will calmly unwind.
Geopolitical uncertainty increases the odds of low-probability, high-impact events that traditional fiat assets cannot hedge reliably. When investors face that uncertainty, they allocate to assets that preserve value outside any single government’s monetary policy—gold is the primary destination. At the same time, continued regional tensions have helped keep Brent crude prices elevated above $95 per barrel, supporting inflation expectations and reducing real purchasing power. Together, higher uncertainty and sustained energy prices strengthen demand for gold as a safe-haven and inflation hedge.
The Edge Every Investor Needs
Smarter precious-metals investing begins with clear, timely insight. The Nuggets Newsletter highlights market moves, Fed updates, global trends and educational resources to help investors make informed choices.
How Does the Fed’s Blackout Period Affect the Gold Price?
The Federal Reserve is in its blackout period ahead of the July 28–29 FOMC meeting. During blackout periods, Fed officials are restricted from making public statements about monetary policy, a constraint that will last through July 30 for this cycle.
That silence is more consequential for gold than it might first appear. Over the past month, hawkish comments from Fed speakers routinely pressured intraday gold rallies. Every public remark hinting at a possible rate hike in September pushed 10-year real yields higher, increasing the opportunity cost of holding non-yielding gold and causing short-lived pullbacks.
With the blackout in effect, that intraday headwind is temporarily removed. The blackout does not change the underlying rate outlook, but it does remove a recurring mechanism that previously capped gold’s intraday gains. Traders now face fewer disruptive commentary-driven swings while awaiting the Fed’s July meeting.
It is also worth remembering the fiscal backdrop: U.S. gross interest costs have surpassed $1 trillion annually and are projected to rise. Each incremental rate hike increases the government’s interest burden on a large and growing national debt. This fiscal reality helps establish a structural support level for gold, independent of short-term Fed signaling. At the time of writing, CME pricing indicated a strong probability that the Fed will hold rates at 3.50–3.75% on July 29.
Why Is Thin Summer Positioning Amplifying the Gold Rally?
The third force is market structure. Global gold ETF holdings remain well below their pandemic-era peak, and institutional positioning is relatively light after several months of outflows during the correction from January’s record $5,589.38 high. With fewer large positions on the books, the market has less depth to absorb sudden buying.
Summer trading tends to be thinner: fewer traders, reduced desk coverage and lower liquidity across venues. When safe-haven demand hits a market that lacks large sell-side offers, each dollar of inflow exerts a larger price impact. In practical terms, the same amount of buying that might move gold a few dollars in a full-season trading month can move it two or three times that in late July. The confluence of geopolitical shock, Fed silence and low ETF inventories therefore produces an outsized price response.
What Does This Rally Mean for Gold’s Structural Case?
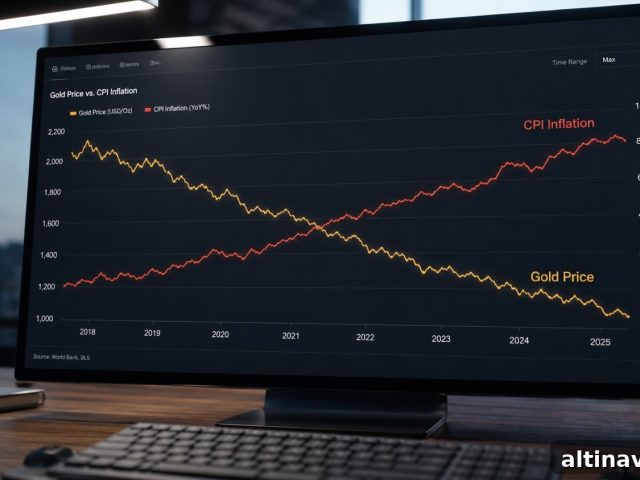
This rally illustrates why gold should be viewed as a multi-factor asset rather than a one-variable trade. Gold responds to a mix of drivers—monetary policy, real yields, geopolitical risk, liquidity and positioning—and its price reflects the interaction of those forces at any moment.
Think of gold like a combination lock: one or two factors turning together create modest movement; three factors aligning against thin market resistance can open the lock and produce a stronger move. That is what happened today.
However, a single day’s rally does not rewrite gold’s structural outlook. The Fed meeting next week and June PCE inflation data arriving July 30 will play decisive roles in determining whether this recovery gathers momentum or consolidates. For longer-term investors, the broader fiscal picture remains unchanged: a national debt above $39 trillion and rising interest costs create persistent upward pressure on assets that preserve purchasing power. Gold functions as a measuring stick for that process, reflecting fiscal and monetary dynamics rather than serving as a speculative bet on immediate outcomes.
Readers seeking additional context on the correction from January’s high and silver’s outlook ahead of the FOMC can consult the related market analyses and commentaries featured in recent coverage.
Stay On Top of Gold & Silver Prices
Get timely market alerts and commentary delivered to your inbox.
SOURCES
1. US Central Command (CENTCOM) — official statement confirming the 11th consecutive night of strikes, July 22, 2026.
2. NPR — reporting on continuing U.S.-Iran hostilities and regional tensions, July 22, 2026.
3. Federal Reserve — FOMC calendar and blackout policy for the July meeting.
4. CME Group — FedWatch probabilities for July 2026.
5. State Street Global Advisors — July 2026 Monthly Gold Monitor on ETF holdings.
6. Congressional Budget Office — federal interest expense projections for 2026.
7. GoldSilver — live spot prices and market commentary, July 22, 2026.
Disclaimer: This article is for informational purposes only and does not constitute financial or investment advice. Consult a qualified financial adviser before making investment decisions.
You May Also Like:
- The Fed Meets July 29. Gold Says Hold Is Already Priced In. Silver Says Something Else.
- Silver Is Up Nearly 5% This Morning. Here Is Exactly Why.
- China Ends Paper Gold Trading July 24. For Physical Holders, That’s a Confirmation.
- Silver Is Up 1.5% Today. Oil Is Up 3%. Those Two Moves Shouldn’t Coexist. Here’s Why They Do.
- Hong Kong Just Ran Its First Gold Settlement. The Banks Who Did It Also Run London’s.
- Consumer Inflation Expectations Just Fell to 4.2%. Gold Fell Too. The Survey Missed the Oil Spike.
Popular Topics
Picked from the archive
-
01
 Topics
After Major Silver Price Crashes: What Investors Can Expect
-
02
Topics
Gold Price Outlook June 2026: CPI Impact and Fed Signals
-
03
Topics
Why Gold Failed to Rally Today: 5 Key Reasons
-
04
Topics
Is the Gold Price Correction Over? Rebound Signals for Investors
-
05
Topics
Why Silver Dropped 3.3% vs Gold’s 1.6%: The Gap Explained
-
06
Topics
How the London Gold Fixing Shapes Global Gold Prices
-
07
Topics
Could Silver Prices Reach $75 After Surging Past $60?
-
08
Topics
Gold Price Near $5,000 as Fed Battles Sticky Inflation