Goldman Cuts Gold Target, JPMorgan Holds: $1,400 Gap Explained
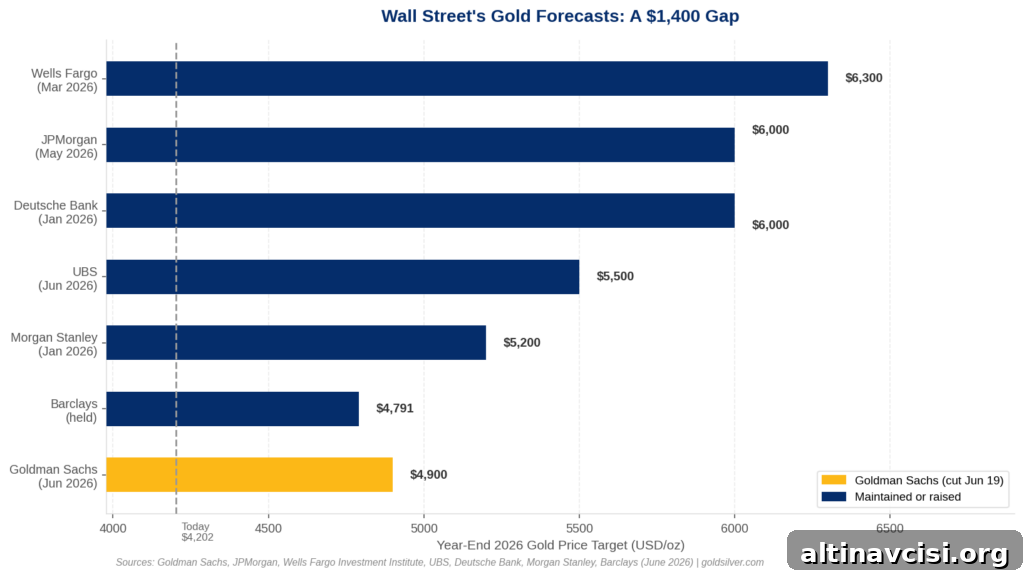
On June 19, Goldman Sachs analysts Lina Thomas and Daan Struyven lowered their year-end gold price target from $5,400 to $4,900. The revision reflects a change in the bank’s view of the Federal Reserve’s rate path: Goldman no longer expects any rate cuts in 2026 and has pushed the first anticipated easing to June 2027.
Other major banks held their targets steady. JPMorgan continues to target $6,000 by year-end. Wells Fargo Investment Institute, which raised its range to $6,100–$6,300 in March 2026, left that view unchanged. Deutsche Bank also continues to forecast $6,000.
At the time of publication, spot gold traded around $4,202. The spread between Goldman’s $4,900 floor and Wells Fargo’s $6,300 ceiling is roughly $1,400 — a meaningful gap that highlights different analytical frameworks rather than simple forecasting noise.
Why Goldman Sachs Revised Its Target
Goldman’s model links gold prices closely to the interest-rate outlook. Their research quantifies the relationship: roughly every 50 basis points of Fed easing supplies about $120 per ounce of upward support for gold, as lower rates reduce the opportunity cost of holding a non-yielding metal and tend to weaken the dollar.
When Goldman’s economists had expected a cut late in 2026 and another in early 2027, those easing assumptions were embedded in the $5,400 forecast. But after the June FOMC meeting — the first under Chair Kevin Warsh — the Fed removed forward guidance and many policymakers shifted expectations. With nearly half of Fed officials indicating at least one hike in 2026 and no consensus for near-term cuts, Goldman removed 2026 easing from its model.
The arithmetic is straightforward in Goldman’s framework: removing one expected cut in late 2026 and another expected cut in early 2027 removes roughly $240 per ounce of rate-driven support. Goldman also reduced some of its ETF flow assumptions. Together, those adjustments produced the $4,900 baseline, with a downside scenario near $4,400 if the Fed tightens policy instead.
Goldman summarized its stance as “structurally constructive but tactically cautious,” signaling that the bank still sees long-term support for gold but expects near-term pressure tied to a less accommodative rate outlook.
Why JPMorgan and Wells Fargo Stayed Put
JPMorgan’s $6,000 year-end target rests on a different analytical foundation: quarterly demand tonnage. Their framework emphasizes how much gold central banks, ETFs, and physical buyers absorb each quarter. JPMorgan’s research suggests that this demand-based metric explains roughly 70% of quarter-over-quarter gold price changes.
By that measure, little has changed. Central-bank purchases remained substantial: in Q1 2026 central banks purchased 244 tonnes of gold, including estimated unreported additions. China’s central bank continued its accumulation, adding nearly 10 tonnes in May and extending a long-running buying streak.
Surveys also show that a large share of central banks plan to expand their gold reserves over the coming year, so their allocation decisions do not hinge on the precise timing of Fed cuts. From this structural, reserve-driven perspective, short-term shifts in Fed guidance are less relevant to the path of gold prices than steady central-bank demand and strategic reserve diversification.
Wells Fargo’s March upgrade to $6,100–$6,300 explicitly cited persistent central-bank demand, the potential for rate cuts, and elevated policy uncertainty as the structural underpinnings for a higher target. The bank framed recent price weakness as a buying opportunity rather than a durable reversal — a stance it has maintained.
Two Different Theories of What Gold Is
The $1,400 gap between Goldman and JPMorgan does not simply reflect two teams reading the same data differently. It reflects two distinct views of gold’s economic role.
Goldman’s approach treats gold primarily as a macro, rate-sensitive asset: a tactical hedge that benefits when real yields fall and the dollar weakens. Under that view, the path of interest rates and near-term monetary policy decisions are the dominant drivers of price moves.
JPMorgan and Wells Fargo instead emphasize gold as a reserve asset: a strategic holding for central banks and sovereign balance sheets seeking to diversify away from dollar exposure. That demand is structural, long-term, and relatively insensitive to individual Fed meetings.
Both frameworks are logically consistent. Which one matters most depends on an investor’s reason for holding gold. If you treat gold as a tactical trade tied to the Fed’s path, Goldman’s rate-driven model should be your guide. If you hold gold as insurance against long-term monetary and fiscal pressures, the reserve-demand framework that underlies JPMorgan’s and Wells Fargo’s forecasts may be more relevant.
What Upcoming PCE Data Does and Doesn’t Change
The Personal Consumption Expenditures (PCE) price index for May will influence gold on the day it is released. The Cleveland Fed’s nowcasting model projected May core PCE at 3.3% year-over-year, unchanged from April. A hotter-than-expected print would bolster the scenario in which gold faces downside pressure from a firmer Fed path; a softer print would ease near-term rate pressure and likely attract tactical buyers back into gold.
Crucially, central banks making multi-tonne purchases each quarter operate on a much longer timetable. Their reserve accumulation decisions are not driven by a single monthly PCE release or a single FOMC statement. That distinction — between rate-driven traders and long-term reserve buyers — is precisely what the $1,400 spread among forecasts reveals.
Stay On Top of Gold & Silver Prices
Get important market alerts sent straight to your inbox.
SOURCES
1. Goldman Sachs Global Investment Research — Gold Price Target Revision, June 19, 2026.
2. Federal Reserve — FOMC Statement and Summary of Economic Projections, June 2026.
3. JPMorgan Global Research — Gold Price Forecast 2026, May 2026.
4. Wells Fargo Investment Institute — Gold Price Target Revision, March 28, 2026.
5. World Gold Council — Gold Demand Trends Q1 2026.
6. Mining.com — Coverage of Goldman’s forecast revision, June 20, 2026.
7. GoldSilver — Gold & Silver Spot Prices, June 22, 2026.
8. Federal Reserve Bank of Cleveland — Inflation Nowcasting, June 2026.
Disclaimer: This article is for informational purposes only and does not constitute financial or investment advice. Consult a qualified financial adviser before making investment decisions.
You May Also Like:
- Gold Price Today, June 19: What Juneteenth Trading Tells You
- Half the Fed Wants a Hike. 45% of Central Banks Are Buying More Gold.
- Silver Hit $69.85 This Morning. Then the FOMC Took It All Back.
- The Fed Went Silent. Gold Holders Don’t Need It to Speak.
- Five Signals That Say Gold’s Correction Is a Reset, Not a Reversal
- The Fed Just Killed Its Rate Roadmap. Here’s What That Means for Gold.
- Gold Holds at $4,347 While Stocks Hit All-Time Highs. Here’s Why.
Popular Topics
Picked from the archive
-
01
 Topics
Gold Price Hits $5,000: Could the Rally Continue?
-
02
Topics
How Quantitative Easing Affects Gold, Silver and Industrial Metals
-
03
Topics
JPMorgan Predicts $6,300 Gold Price After Historic Crash
-
04
Topics
Gold vs Inflation: What 100 Years of Data Reveals
-
05
Topics
How to Dollar-Cost Average into Gold and Silver
-
06
Topics
Why Gold Soared 40% This Year After Moody’s Downgrade
-
07
Topics
China’s Biggest Gold Buy Since 2023 as Prices Fall 16%
-
08
Topics
Why Gold Prices Are Falling Despite Global Turmoil