5 Signs Gold’s Correction Is a Reset, Not a Reversal
In today’s update: The 2026 gold outlook looks different than many headlines suggest — a record 45% of central banks plan to add gold, Barclays maintains a $4,900 target, and CPM Group says the structural drivers remain intact.
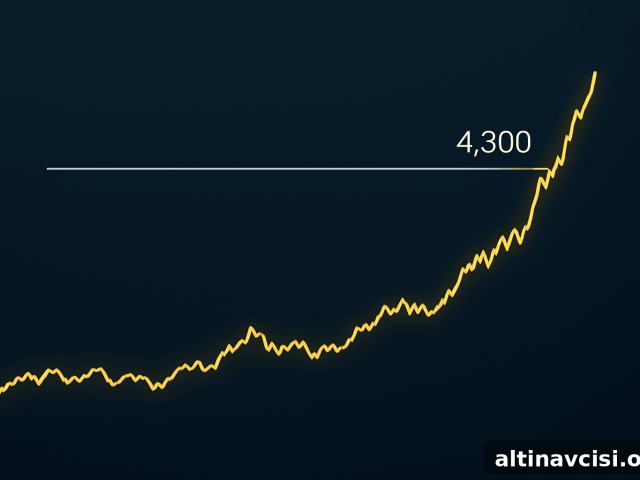
Five institutional reports published in the past 72 hours — from the World Gold Council, Barclays, CPM Group, LSEG, and J.P. Morgan — reinforce the view that gold’s roughly 22% pullback from its January 2026 all-time high of $5,589 represents a repositioning rather than a collapse of the long-term case. As of June 17, 2026, gold traded near $4,330 after a selloff sparked by the Iran conflict. The market’s short-term dynamics shifted, but the structural thesis for gold remains supported by central bank demand, inflation dynamics, and geopolitical risk. Below I summarize the evidence and what it implies for investors.
Is the FIFA World Cup Trophy the Most Accurate Gold Chart of 2026?
The FIFA World Cup trophy is made of 18-karat gold and its physical metal content hasn’t changed — what has changed is the value of that metal. LSEG’s June 11, 2026 analysis estimates the trophy’s gold is worth roughly $713,000 today, up from about $277,000 at the 2022 Qatar tournament. That 157% increase over four years is a reminder that a fixed-weight, physical asset can rise sharply in dollar terms as the currency loses purchasing power. This isn’t primarily a market story driven by short-term flows or headlines; it is a monetary story about currency value and reserve asset behavior, and it applies to every ounce held in vaults worldwide.
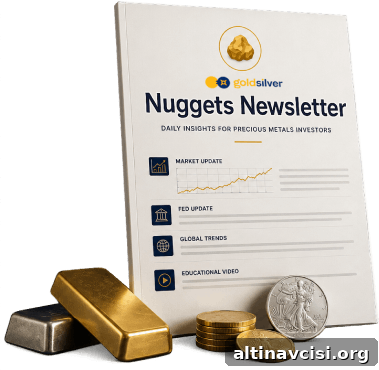
The Edge Every Investor Needs
Smarter precious metals investing starts here. The Nuggets Newsletter delivers market insights, Fed updates, global trends, and educational content to help you stay informed.
Why Are 45% of the World’s Central Banks Planning to Buy More Gold in 2026?
The World Gold Council’s 2026 Central Bank Gold Reserves Survey, conducted between February 5 and May 19 with responses from 76 central banks (the highest participation in the survey’s nine-year history), found that a record 45% of respondents plan to increase gold holdings over the next 12 months, up from 43% in 2025. An even larger share — 89% — expect overall central bank gold holdings to rise. Reserve managers cited gold’s resilience in times of financial stress, its role in portfolio diversification, and its value as an inflation hedge. The survey also reported that 74% of reserve managers expect the dollar’s share of global reserves to fall moderately or significantly over the next five years. This is not a fringe opinion; it reflects the collective view of the institutions that manage sovereign reserves.
Does Barclays Still See $4,900 Gold After a 20–25% Correction?
Barclays’ cross-asset research team published an update on June 16 assessing the January-to-June selloff. The bank cited three near-term drivers: a stronger U.S. dollar, an equity rally that redirected risk capital away from defensive assets, and the unwinding of leveraged gold positions. Sales by some central banks, notably Russia and Turkey, added pressure but did not signal a structural collapse. Barclays kept its 2026 forecast at $4,791 and its 2027 target at $4,900, while estimating fair value near $4,150 — meaning current prices around $4,330 sit above their fair-value baseline. Barclays expects the dollar’s downtrend to resume, central bank buying to continue, and persistent inflation to support a price floor for gold. In short, Barclays views the move as a temporary repositioning rather than a broken thesis.
What Does Kevin Warsh’s First FOMC Press Conference Mean for Gold?
Kevin Warsh’s first FOMC press conference as Federal Reserve Chair is a key near-term event. Markets are pricing a high probability that rates will remain unchanged at the meeting, but the dot plot and the tone of the press conference matter more than the decision itself. J.P. Morgan strategists noted that the Fed may shift from an easing bias toward a neutral stance. A neutral-to-hawkish signal, which could imply a possible hike later in the year, would strengthen the dollar and put pressure on gold. Conversely, a neutral-to-dovish tilt would likely soften the dollar and support further gold gains. Either way, clearer policy guidance reduces the uncertainty that has complicated gold’s price path in recent weeks — and gold typically performs better when rate expectations are explicit rather than ambiguous.
What Is CPM Group’s Gold Price Outlook for the Rest of 2026?
CPM Group’s managing partner Jeffrey Christian described the June selloff as driven primarily by investor selling, profit-taking, and short-selling rather than a degradation of fundamentals. CPM Group noted that gold tested the $4,100 area and may trade through a volatile consolidation phase before resuming an upward trend later in the year. Silver, which pulled back toward the mid-$60s per ounce, may experience a similar consolidation. Christian flagged the FOMC decision as the main near-term catalyst but emphasized that structural drivers remain intact: elevated geopolitical and economic risks and persistent institutional demand. CPM Group’s view is that higher prices will return once consolidation gives way to renewed buying.
What Do These Five Institutional Signals Say About the 2026 Gold Price Outlook?
Taken together, five institutional sources using different methodologies reach a similar conclusion: the recent correction was largely a positioning adjustment, not a structural reversal of gold’s long-term outlook. The World Gold Council documents record central bank intent to buy. Barclays maintains a near-term target in the high $4,000s. CPM Group sees the fundamental drivers as intact. At the same time, U.S. national debt levels and the IMF’s reports on reserve currency composition underscore ongoing macro pressures on the dollar. The market moved — leverage, sentiment, and a geopolitical shock amplified the move — but the architecture that supports gold’s thesis has not changed. Distinguishing between short-term price moves and long-term structural trends is essential for investors who plan to hold through volatility instead of reacting to every dip.
Stay On Top of Gold & Silver Prices
Receive timely market alerts and analysis delivered to your inbox.
SOURCES
1. GoldSilver — Gold Price Charts
2. LSEG — Golden Goal: Football’s Top Prize Is the World’s Most Valuable Trophy
3. World Gold Council — 2026 Central Bank Gold Reserves Survey
4. TheStreet — Analysis of Barclays’ note on the gold selloff
5. J.P. Morgan — Coverage of Kevin Warsh’s first Federal Reserve meeting as Chair
6. CME Group — Fed probability tools and market pricing
7. IndexBox — Coverage of CPM Group analysis of precious metals
8. U.S. Treasury — Fiscal Data: Debt to the Penny
9. IMF — Currency Composition of Official Foreign Exchange Reserves (COFER)
10. GoldSilver — Silver Price Charts
Disclaimer: This article is for informational purposes only and does not constitute financial or investment advice. Consult a qualified financial adviser before making investment decisions.
You May Also Like:
- The Fed Just Killed Its Rate Roadmap. Here’s What That Means for Gold.
- Gold Holds at $4,347 While Stocks Hit All-Time Highs. Here’s Why.
- Why Is Silver Up Today? The Iran Deal Changed the Fed Math
- Gold Up 3%, Silver Up 4.7%: Five Forces Driving Metals Higher Today
- Iran Peace Deal Sends Oil Down 5%, Gold Up 3%
- Gold & Silver Surge on Iran Peace Deal — Then Pull Back
- Silver Fell 22% in 30 Days. Gold-Silver Ratio Hits 63.
- Every Bearish Catalyst Landed at Once. Gold and Silver Went Up Anyway.
- Gold at Seven-Month Lows: Why Geopolitical Fear Is Not Enough
- Gold Slides to $4,130 as Iran War Turns Inflation Against It
- May CPI Printed 4.2% Core Inflation Beat. So Why Did the Gold Price Drop?
Popular Topics
Picked from the archive
-
01
 Topics
What the Fed’s 3-Day Silence Means for Gold Prices
-
02
Topics
Gold Jumps to $4,746 as Oil Crashes: Why Investors Are Bullish
-
03
Topics
How Government Debt Drives Gold and Silver Prices
-
04
Topics
Can Gold Hold at $4,300? Price Outlook for Investors
-
05
Topics
Why Gold and Oil Move Opposite and What It Means for Investors
-
06
Topics
Gold and Silver Prices: Short-Term Volatility, Long-Term Trend
-
07
Topics
Wholesale Prices Jump Most in 3 Years as Tariffs Hurt US Economy
-
08
Topics
Why Silver Jumped 6% Before Trump Xi Summit