Fed Abandons Rate Roadmap: What It Means for Gold Prices
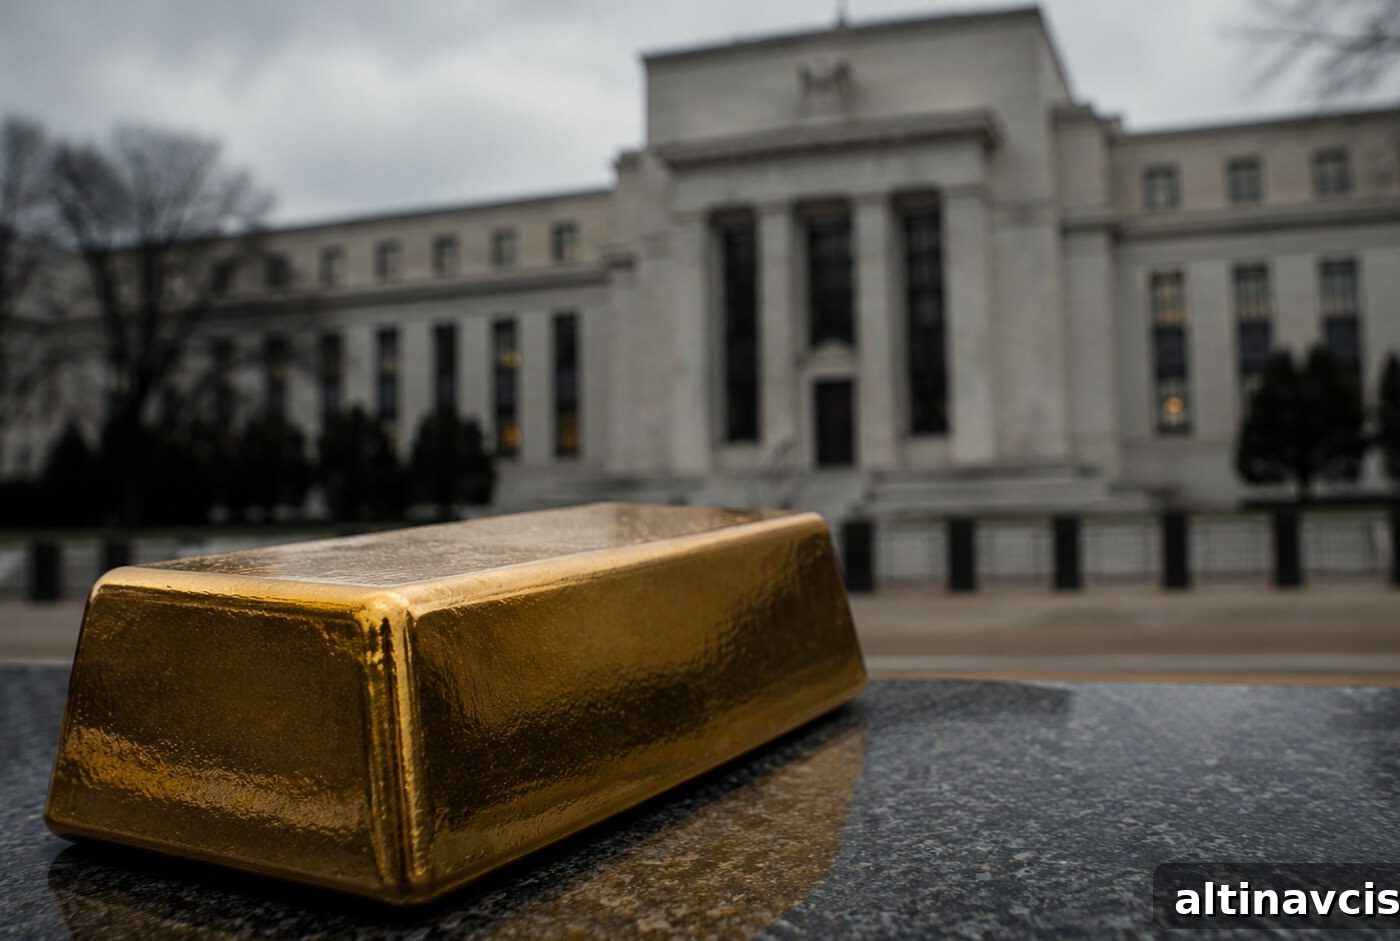
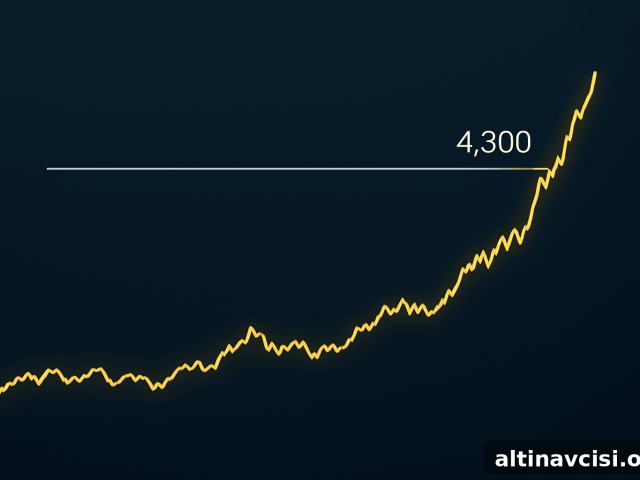
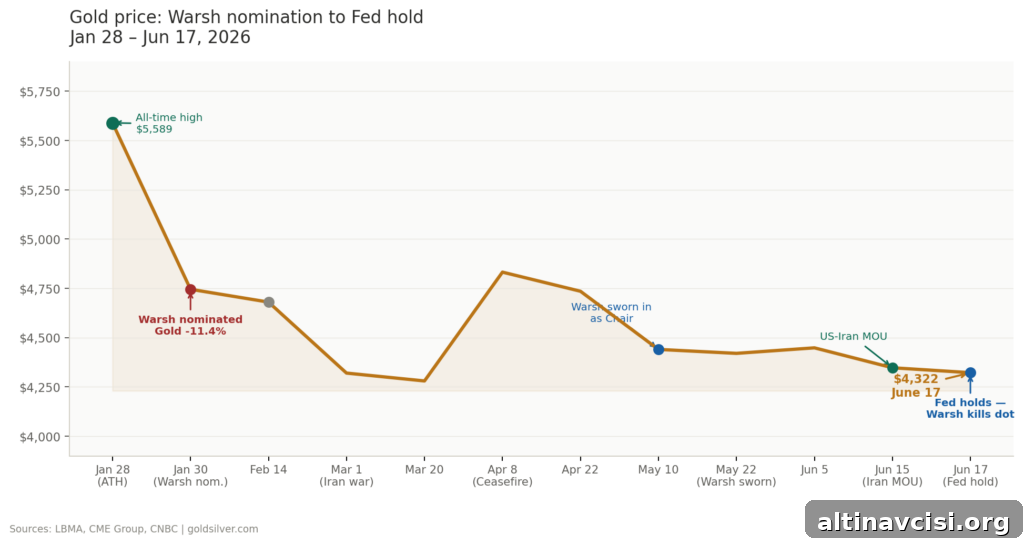
Gold is trading at $4,322 an ounce today and the price barely budged on the news. That calm is the point.
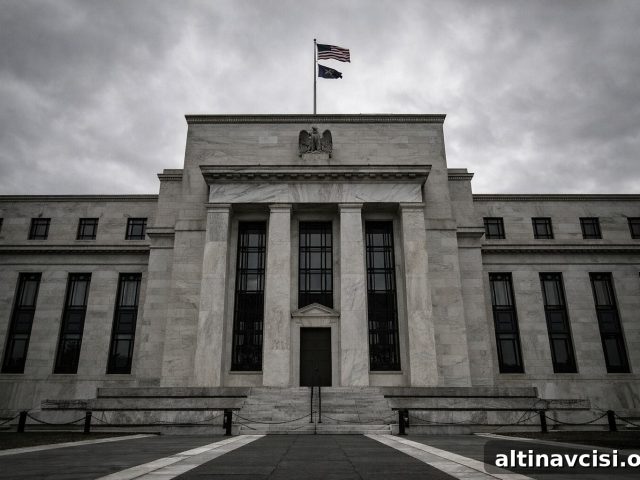
The Federal Reserve left interest rates unchanged at 3.50%–3.75% on Wednesday. The decision was widely expected — futures markets had priced a pause at roughly 97% going into the meeting (CME FedWatch, June 13, 2026). What matters for owners of physical gold, however, is what Chair Kevin Warsh did alongside the rate decision.
Warsh declined to submit a personal projection to the Fed’s quarterly “dot plot.” By opting out, he became the first Fed chair in 14 years not to participate in a forecasting tool that has shaped market expectations since 2012. That action is more than symbolic: it signals a different approach to communication and policymaking going forward.
Who is Kevin Warsh, and why does his first meeting matter?
Kevin Warsh was sworn in as the 17th Federal Reserve Chair on May 22, 2026. His confirmation in the Senate was a narrow 54–45 vote, the most partisan confirmation in Fed history. Wednesday marked his first meeting leading the Federal Open Market Committee.
Warsh inherited a split committee. At the April 2026 meeting under former Chair Jerome Powell, the FOMC recorded an 8–4 vote — the most contentious outcome since 1992 — and Warsh began his tenure managing that division.
He also brought a clear philosophical stance. During his April 2026 confirmation hearing, Warsh stated he does not support tying forward guidance on interest rates to economic data. That statement foreshadowed his decision this week to sit out the dot plot.
The Edge Every Investor Needs
Smarter precious metals investing starts here. The Nuggets Newsletter brings market insights, Fed updates, global trends, educational videos, and more.
What is the dot plot, and why does it matter for gold investors?
The dot plot is a quarterly chart the Fed has published since 2012. Each FOMC participant submits an anonymous projection for where the policy rate should be at year-end; those projections appear as a cluster of dots that markets read as a map of likely rate paths.
Ben Bernanke introduced the dot plot after the 2008 crisis to provide forward guidance when rates were near zero. For years the chart became the Fed’s primary way of signaling future policy, helping markets form expectations in advance.
That clarity helped for a time — but it also created a trap. In 2021 the Fed signaled rates would remain near zero “for an extended period.” Markets treated that guidance as a promise. When inflation surged, the Fed had to pivot quickly, producing a large bond-market sell-off. Warsh has repeatedly cited that episode as evidence that turning projections into commitments reduces the Fed’s flexibility and magnifies policy errors.
On Wednesday, he acted on that view by declining to offer his own dot.
Does a less predictable Fed help or hurt gold?
This is the central question for long-term holders of physical gold. To answer it, we must look at the forces that actually move gold prices.
Gold does not produce interest income, so many observers say it suffers when interest rates rise. The more precise relationship is with real yields — nominal Treasury yields adjusted for inflation. When real yields fall well into negative territory, meaning inflation erodes the real return on cash and bonds, gold becomes an attractive store of value because it preserves purchasing power even though it doesn’t yield interest.
When the Fed provided firm forward guidance, one source of uncertainty diminished: savers could estimate the return on cash with more confidence. That reduced one structural incentive to hold a non-yielding asset like gold. In short, a highly predictable Fed suppressed a natural tailwind for gold.
Conversely, a Fed that refuses to forecast forces markets to react to incoming economic data — jobs, inflation, and growth — rather than a preannounced path. Policy surprises become more likely, and uncertainty rises. In such an environment, assets that benefit from monetary ambiguity, including physical gold, can attract more demand as investors seek protection from unclear future returns.
What did the dot plot itself show on Wednesday?
Eighteen other committee members submitted projections. According to commentary from several economists, at least three members showed a projection consistent with a rate hike in 2026. Markets now assign roughly a two‑thirds probability of at least one hike by December — a marked reversal from the start of the year, when market pricing included two cuts.
Mechanically, higher nominal rates can push real yields higher, which raises the opportunity cost of holding non‑yielding gold and can act as a headwind. That interplay between nominal rates, inflation, and market expectations is central to how gold behaves in different monetary regimes.
Is the hawkish Warsh discount already priced into gold?
Markets began pricing a hawkish Warsh months ago. On January 30, 2026 — the day Warsh was nominated — gold closed sharply lower compared with the session open, erasing much of the “dovish Fed” premium that had pushed prices to their record. At $4,322 today, gold sits roughly 23% below its January peak, which suggests much of the hawkish expectation was already reflected in the market.
The current question is whether the actual Chair Warsh — balancing a divided committee, assessing incoming inflation and job data, and without a political mandate to impose hikes — will be as consistently hawkish as markets feared. His decision not to publish a dot leans toward pragmatism: a leader unwilling to make pledges he cannot credibly keep.
What does this mean for people holding physical gold?
The structural backdrop shifted today toward greater uncertainty. If the Fed moves away from quarterly forecasts and explicit forward guidance, markets will need to interpret policy by watching economic prints rather than relying on preannounced rate paths. That makes the monetary environment less legible.
For most assets, less predictability is a negative. For gold, however, it can be a tailwind. When savers cannot reliably forecast what cash will earn, some investors seek a durable store of value. Physical gold has served that role across centuries, not because it pays interest, but because it preserves real purchasing power when monetary signals become unclear.
What are central banks signaling about gold right now?
Central banks purchased 244 net tonnes of gold in the first quarter of 2026. They continued to buy even as prices fell from their January highs. These are sovereign reserve managers making long-horizon decisions, not short-term momentum traders. Their activity suggests a preference for physical gold as a reserve asset during a period of monetary transition and uncertainty.
Put together, the signals are consistent: a new Fed chair who declines to forecast, central banks accumulating metal through a correction, and real yields that will now be driven by unpredictable economic data. Those forces point in the same direction and underline why physical gold can serve as a hedge when the monetary system becomes less legible.
Stay On Top of Gold & Silver Prices
Get important market alerts sent straight to your inbox.
SOURCES
1. LBMA — Precious Metal Prices
2. CME Group — FedWatch Tool, June 2026 FOMC Probabilities
3. Federal Reserve Board — FOMC Meeting Calendars and Statements
4. Federal Reserve Bank of San Francisco — Ben Bernanke: Solving a Crisis, Changing the Fed
5. U.S. Senate — Kevin Warsh Confirmation Vote, May 13, 2026
6. CNBC — Coverage of Fed Chair Warsh and dot plot reporting, June 2026
7. Federal Reserve Bank of St. Louis (FRED) — 10-Year Real Interest Rate
8. CNBC — Market reaction to Warsh nomination, January 30, 2026
9. World Gold Council — Gold Demand Trends Q1 2026
Disclaimer: This article is for informational purposes only and does not constitute financial or investment advice. Always consult a qualified financial adviser before making investment decisions.
You May Also Like:
- Gold Holds at $4,347 While Stocks Hit All-Time Highs. Here’s Why.
- Why Is Silver Up Today? The Iran Deal Changed the Fed Math
- Gold Up 3%, Silver Up 4.7%: Five Forces Driving Metals Higher Today
- Iran Peace Deal Sends Oil Down 5%, Gold Up 3%
- Gold & Silver Surge on Iran Peace Deal — Then Pull Back
- Silver Fell 22% in 30 Days. Gold-Silver Ratio Hits 63.
- Every Bearish Catalyst Landed at Once. Gold and Silver Went Up Anyway.
- Gold at Seven-Month Lows: Why Geopolitical Fear Is Not Enough
- Gold Slides to $4,130 as Iran War Turns Inflation Against It
- May CPI Printed 4.2%. Core Inflation Beat. So Why Did the Gold Price Drop?
Popular Topics
Picked from the archive
-
01
 Topics
What the Fed’s 3-Day Silence Means for Gold Prices
-
02
Topics
Gold Jumps to $4,746 as Oil Crashes: Why Investors Are Bullish
-
03
Topics
How Government Debt Drives Gold and Silver Prices
-
04
Topics
Can Gold Hold at $4,300? Price Outlook for Investors
-
05
Topics
Why Gold and Oil Move Opposite and What It Means for Investors
-
06
Topics
Gold and Silver Prices: Short-Term Volatility, Long-Term Trend
-
07
Topics
Wholesale Prices Jump Most in 3 Years as Tariffs Hurt US Economy
-
08
Topics
Why Silver Jumped 6% Before Trump Xi Summit