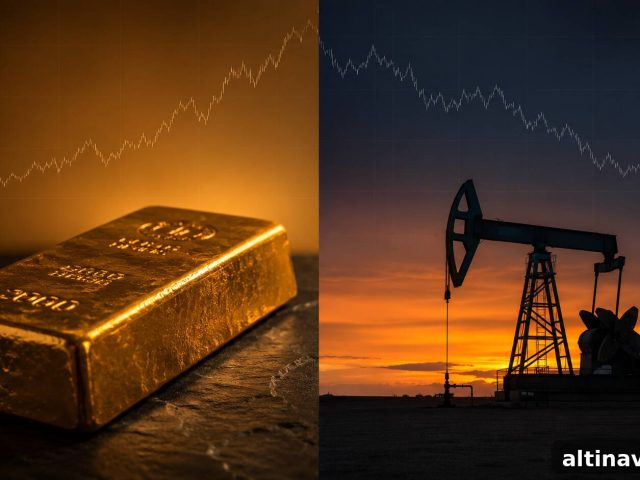
Iran Peace Agreement Drops Oil 5% While Gold Gains 3%
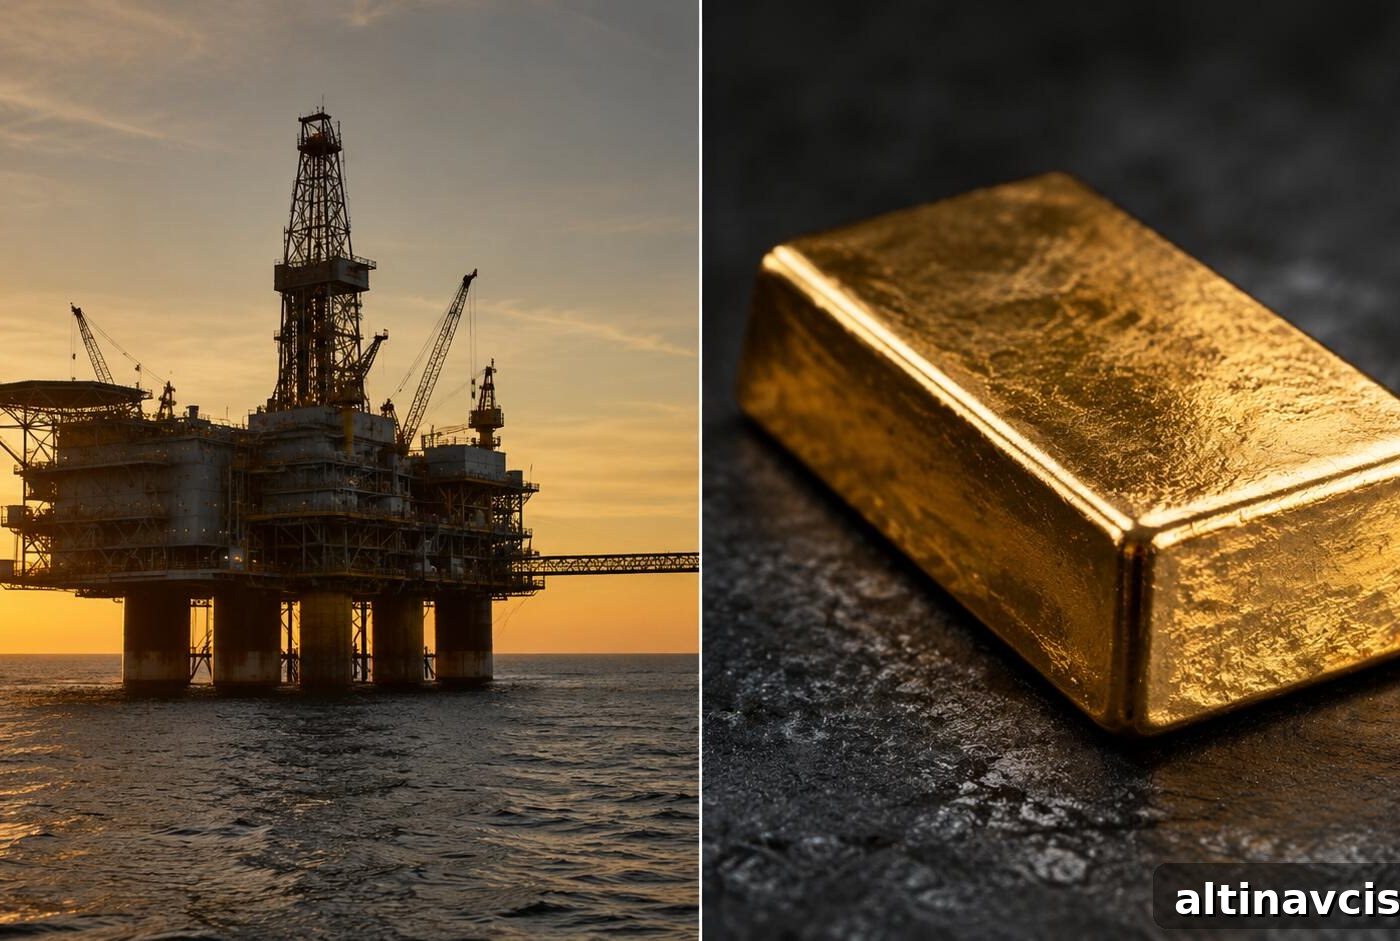
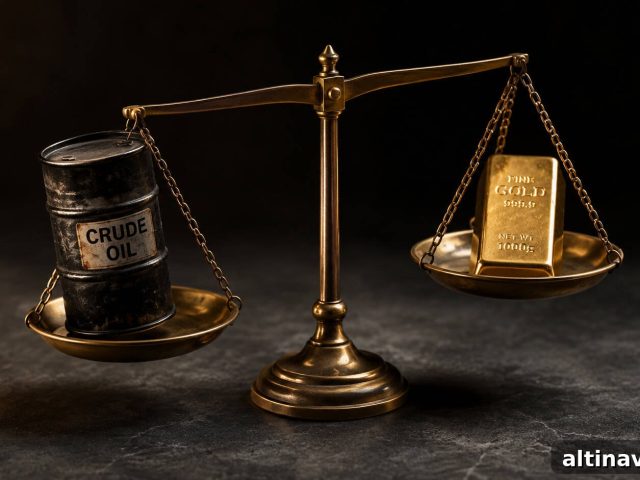
On Sunday night Pakistan’s Prime Minister announced that the United States and Iran had reached a peace agreement that is expected to end nearly four months of conflict. The formal signing is scheduled for Friday in Switzerland. Markets reacted immediately: oil plunged on Monday, with WTI crude falling more than 5% to roughly $80 a barrel, a two-month low (TradingEconomics, June 15, 2026).
At the same time, gold climbed.
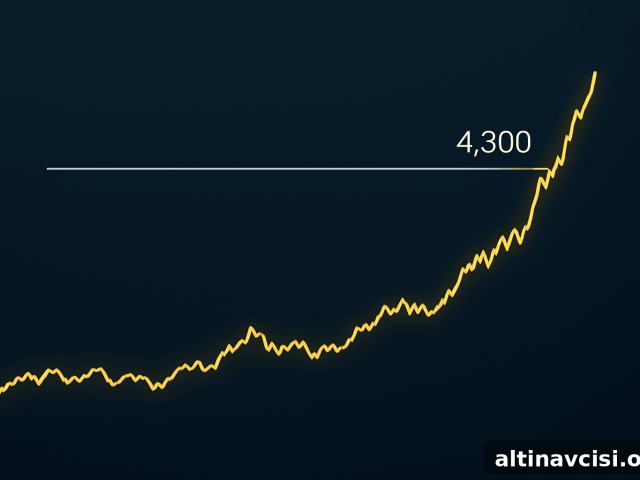
Not down, not flat. Spot gold rose about 2.7% to trade above $4,300 an ounce (GoldSilver.com price charts, June 15, 2026). Silver also rallied, gaining nearly 4% to trade above $70.50. Both metals moved higher on the same headline that sent oil sharply lower.
Many outlets described this as a classic safe-haven trade — the assumption that gold rises when uncertainty increases. But that interpretation does not explain what actually happened. The peace deal is intended to reduce uncertainty, yet gold rose. The reason lies in the economic chain that links oil, inflation, interest rates and precious metals.
Why Did the Iran Conflict Pressure Gold Prices?
It may seem counterintuitive, but the Iran conflict turned out to be one of the most important downward forces on gold in recent months. The confrontation escalated on February 28, when US and Israeli strikes targeted Iranian nuclear facilities. The crisis led Iran to close the Strait of Hormuz, through which about one-fifth of seaborne oil trade transits. That closure produced an abrupt supply shock.
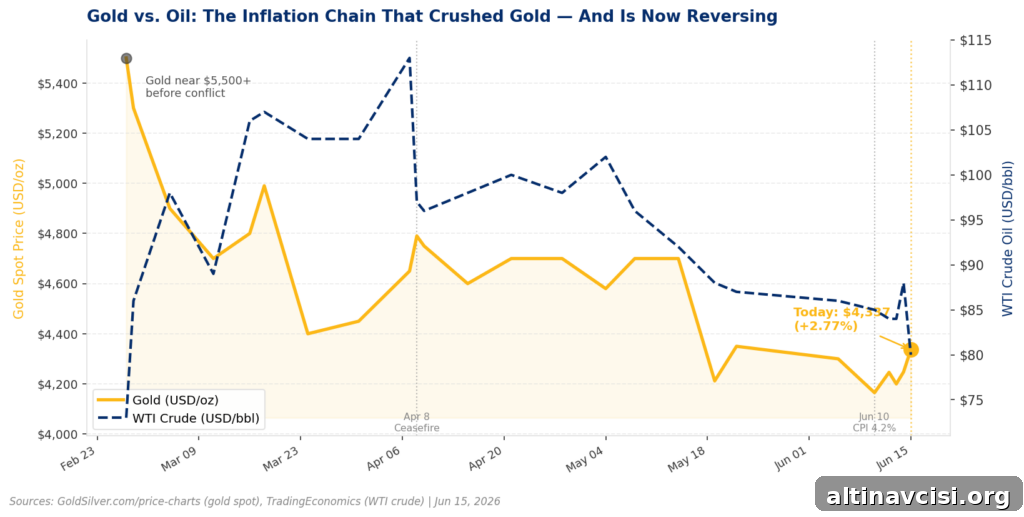
Oil prices surged. Brent crude rose from roughly $70 a barrel to above $114 by mid-March — one of the largest single-month gains on record (TradingEconomics, March 2026). That spike flowed through to consumer prices: by May US inflation had climbed to 4.2% year over year, the hottest reading since April 2023 (Bureau of Labor Statistics, June 10, 2026). Energy costs accounted for more than 60% of the monthly increase.
Normally, higher inflation supports the appeal of gold. In this episode the inflationary shock carried a different consequence: it strengthened the Federal Reserve’s incentive to consider further rate increases. Rising interest-rate expectations made newly issued US Treasuries more attractive because they pay higher yields. Gold, which pays no interest or coupon, lost relative appeal. Investors rotated out of metals and into yield-bearing assets.
In short: the Hormuz closure produced an oil shock → the oil shock pushed inflation higher → higher inflation increased the odds of Fed rate hikes → yields rose → gold underperformed. Gold’s peak of $5,589 on January 28, 2026 (GoldSilver.com) gave way to a roughly 25% decline by June 10, reaching lows near $4,165 as market participants priced in a higher-rate scenario.
Why Is the Peace Deal Lifting Gold Now?
The mechanism is simply running in reverse. If the peace agreement holds, it reopens the Strait of Hormuz and restores oil flows from the Gulf, removing the supply disruption that drove prices higher. Oil’s sharp drop — more than 5% on the day of the announcement — reflects that expectation (TradingEconomics; OilPrice.com, June 15, 2026).
Lower oil prices reduce energy-driven inflation. With energy inflation easing, the Federal Reserve’s case for raising rates weakens. As interest‑rate expectations decline, the relative attractiveness of non-yielding assets like gold improves. That is why gold rose on peace news: markets are repricing the inflation-and-rates pathway that had weighed on precious metals over the prior months.
Markets reduced the probability of a December rate hike from about 69% before the deal to roughly 53% after it, according to the CME FedWatch Tool (via CNBC, June 15, 2026). Gold reacts sensitively to shifts in rate expectations; a 16-point move in odds is a meaningful change for metal prices.
Stay Informed on Precious Metals Markets
Timely market context helps long-term investors understand price moves.
What the Fed Decision Means for Gold This Week
The Federal Reserve convenes for its June 16–17 policy meeting, the first under Chair Kevin Warsh, who was sworn in on May 22. The rate decision itself is largely priced in: markets assigned about a 97% probability of no change going into the meeting (CME FedWatch Tool, June 9, 2026). What remains uncertain is the path of future policy, and that will depend on Warsh’s tone at the press conference.
Analysts noted that Warsh could influence forward guidance by leaning more dovish if the inflation outlook improves after a resolution in Hormuz (Investing.com, June 15, 2026). If he signals that the peace deal reduces the need for higher rates, the chain that pressured gold will unwind further and markets’ six weeks of heightened rate uncertainty should begin to resolve.
At the same time, central-bank demand for gold has remained robust. The World Gold Council reported net central bank purchases of 244 tonnes in Q1 2026, with another 17 tonnes added in April. China has added to reserves for 18 consecutive months (World Gold Council, June 3, 2026). These institutional buyers continued to accumulate through the pullback rather than abandoning the market.
What the Iran Peace Deal Means for Long-Term Holders of Gold and Silver
For long-term holders of physical gold and silver, the recent price action underscores an important lesson: headlines do not always predict the direction of precious-metal prices. The Iran conflict appeared bullish for gold but ended up creating inflationary pressures that pushed rates higher and gold lower. Now, a peace deal appears bearish on its surface for metals but is in fact easing the inflation-and-rate headwind and helping prices recover.
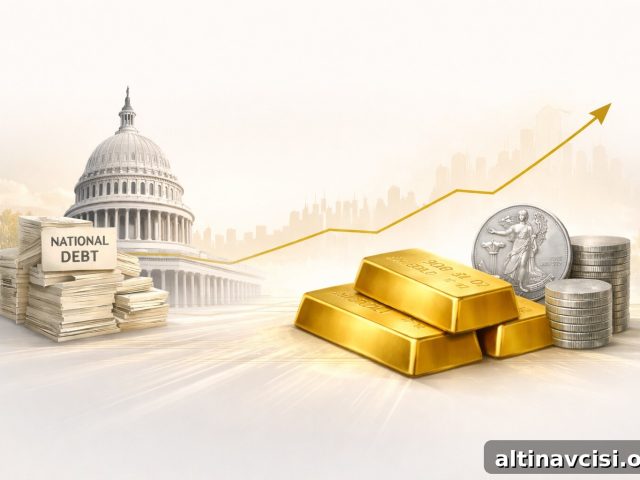
Understanding the economic mechanism — the path from oil to inflation to interest rates to gold — is more useful than reacting to geopolitical headlines alone. The structural case for holding physical gold and silver remains intact: government spending in many economies continues to outpace revenue, central banks still hold large positions, and institutional forecasts cited by major firms remain above current market levels. The peace agreement removes a short-term headwind rather than altering the long-term thesis for precious metals.
That is not complicated; it is how money and markets interact when supply shocks, inflation, and monetary policy expectations converge.
Sources (selected)
TradingEconomics — Crude oil and Brent crude historical data, June–March 2026.
OilPrice.com — Coverage of the oil price reaction to the US–Iran agreement, June 15, 2026.
Bureau of Labor Statistics — US Consumer Price Index, May 2026.
GoldSilver.com — Live gold and silver price charts and historical highs.
CME Group — FedWatch Tool, June 2026.
World Gold Council — Central bank gold demand and statistics, Q1 2026 and April updates.
Disclaimer: This article is for informational purposes only and does not constitute financial or investment advice. Consult a qualified financial adviser before making investment decisions.
You May Also Like:
- Gold & Silver Surge on Iran Peace Deal — Then Pull Back
- Silver Fell 22% in 30 Days. Gold-Silver Ratio Hits 63.
- Every Bearish Catalyst Landed at Once. Gold and Silver Went Up Anyway.
- Gold at Seven-Month Lows: Why Geopolitical Fear Is Not Enough
- Gold Slides to $4,130 as Iran War Turns Inflation Against It
- May CPI Printed 4.2%. Core Inflation Beat. So Why Did the Gold Price Drop?
Popular Topics
Picked from the archive
-
01
 Topics
What the Fed’s 3-Day Silence Means for Gold Prices
-
02
Topics
Gold Jumps to $4,746 as Oil Crashes: Why Investors Are Bullish
-
03
Topics
How Government Debt Drives Gold and Silver Prices
-
04
Topics
Can Gold Hold at $4,300? Price Outlook for Investors
-
05
Topics
Why Gold and Oil Move Opposite and What It Means for Investors
-
06
Topics
Gold and Silver Prices: Short-Term Volatility, Long-Term Trend
-
07
Topics
Wholesale Prices Jump Most in 3 Years as Tariffs Hurt US Economy
-
08
Topics
Why Silver Jumped 6% Before Trump Xi Summit