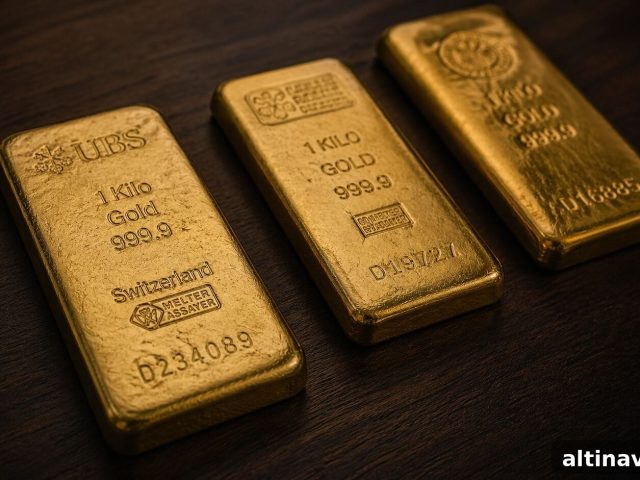
Rate Hike Fears Weigh on Gold Prices: Full Market View

Gold finds itself at a crossroads. The price eased to $4,448 this week (data as of June 5, 2026), marking the weakest weekly performance in a month. Short-term headlines focus on fears of further central bank rate hikes. But the longer-term picture — driven by central bank buying, historical patterns, and the sound-money case for precious metals — paints a more nuanced view.
This summary highlights five developments that matter to anyone holding gold or silver. Short-term noise and long-term structure often point in different directions; understanding both is essential for informed decisions.
Why Are Rate-Hike Fears Pressuring Gold This Week?
Gold slipped to roughly $4,448.72 per ounce on Friday (June 5, 2026), down about 2% from Monday’s open. Silver moved lower as well, trading near $72.65 per ounce. Platinum and palladium also posted weekly losses.
Two main factors explain the decline. First, hopes for a quick U.S.-Iran diplomatic resolution faded: Hezbollah rejected a proposed ceasefire in Lebanon and Israel signaled it would maintain troops in the area. That stalemate kept oil prices elevated, which in turn supports firmer inflation expectations. Sustained inflation expectations make the Federal Reserve more likely to remain hawkish.
Second, comments from policymakers intensified rate-hike expectations. Federal Reserve officials, including the Kansas City Fed president, emphasized that the central bank faces a choice between holding rates steady or raising them further to contain inflation that has exceeded the target for years. Futures markets priced a meaningful probability of another rate increase by December 2026. Because gold pays no interest, higher policy rates raise the opportunity cost of holding it — and that mechanism, more than geopolitics alone, dominated this week’s downward pressure.

The Edge Every Investor Needs
Smarter precious-metals investing starts with timely analysis. Our newsletter delivers concise market updates, Fed commentary, global trends, and educational resources.
What Does the U.S. Jobs Report Mean for Gold Today?
Technically, gold is hovering just above its 200-day simple moving average (around $4,432), a key level many traders watch. The May nonfarm payrolls report, due later today, is likely to determine whether gold breaks that support or rebounds from it.
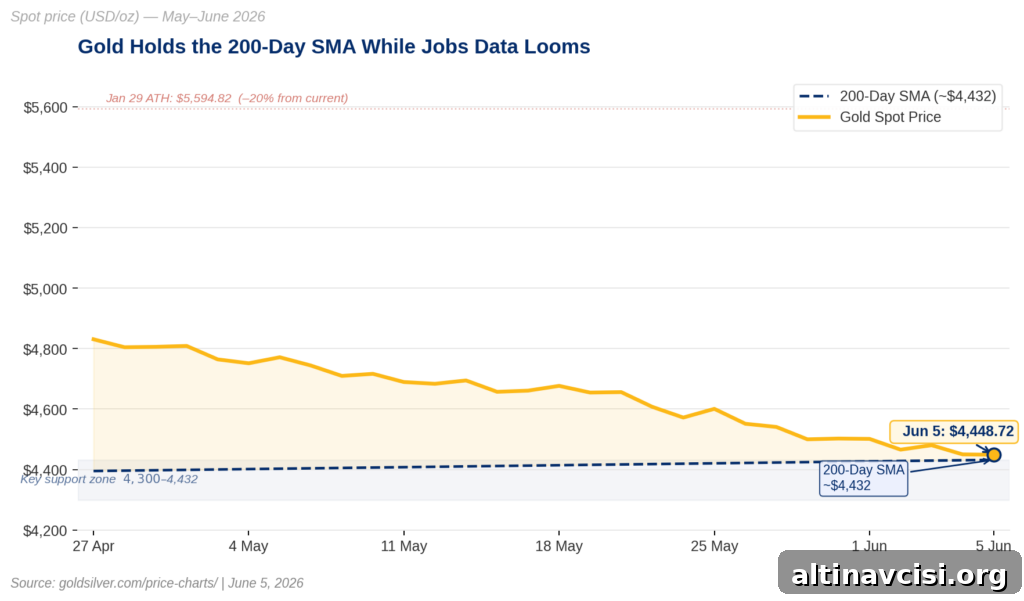
Consensus forecasts expect headline payroll gains of roughly 85,000 for May, down from 115,000 in April, with the unemployment rate holding near 4.3%. A stronger-than-expected reading would underscore economic resilience and support the Fed’s case for keeping policy restrictive or hiking, which would likely push gold toward the $4,350–$4,300 area. A softer jobs report would cut rate-hike odds, potentially helping gold reclaim shorter-term levels such as the 21-day moving average near $4,551.
Momentum indicators offer a neutral-to-bearish near-term picture: the Relative Strength Index sits around 40, and the MACD is below zero. Those readings do not indicate a crash, but they suggest the path of least resistance is sideways to lower unless a fresh catalyst appears.
Why Are Central Banks Still Buying Gold While Retail Demand Slows?
Central banks continued heavy purchases in early 2026, adding roughly 244 tonnes of gold in Q1, according to World Gold Council data. If sustained, that pace would rank among the highest rates of central-bank demand since 1950. Central-bank buying has been consistently strong since 2025, reflecting a deliberate diversification away from paper assets.
By contrast, retail demand has cooled. Jewelry demand fell roughly 25% year-over-year in Q1 2026, while ETF inflows weakened substantially. Policy changes such as higher import taxes in India and softer consumer buying in China have contributed to lower retail volumes.
The divergence between institutional and retail demand is important. Retail investors tend to react to price moves; central banks make strategic reserve decisions. Many central banks view gold as a non-sovereign reserve asset without counterparty risk and less vulnerable to foreign restrictions or freezes — a consideration highlighted by events since 2022. That structural demand continues to underpin a long-term floor for prices even when short-term market sentiment turns negative.
As ING’s commodities strategists note, near-term direction will likely be governed by U.S. interest rates, the dollar, and inflation. But central-bank accumulation introduces a structural element that operates over a much longer horizon.
Is This Pullback Normal, or Is Something Different This Time?
Gold peaked at an all-time high of $5,594.82 per ounce on January 29, 2026, and has since retreated about 20% to current levels near $4,448. Corrections of this size are not unprecedented after strong rallies. For example, gold experienced deep declines after major surges in the past decade-plus, including sustained pullbacks following earlier multi-year gains.
What set the recent rally apart was the simultaneous action of three forces: elevated central-bank buying, strong retail demand in China and India, and investor flows driven by inflation concerns and reserve diversification. Those forces aligned for several years, producing the multi-year advance. Today, retail demand has cooled and market attention has shifted to rate expectations, making gold’s near-term path more sensitive to Fed policy than during the peak rally.
The bigger question is whether the structural drivers — de-dollarization trends, rising fiscal deficits, and sustained central-bank accumulation — have permanently changed gold’s valuation relative to other assets. Current evidence suggests that much of the structural repricing remains intact: prices are materially higher than before the shift began, and institutional demand continues to support a baseline for prices over the long term. That pattern looks more like durable repricing than a short-lived speculative bubble.
What Does the Sound-Money Case for Gold and Silver Look Like Today?
Economists and analysts who emphasize monetary stability argue that precious metals remain attractive as protection against long-term currency debasement. Thorsten Polleit, a prominent representative of the Austrian School of Economics, recently reiterated that view: over the past two years gold and silver have posted large gains, moving prices into levels that warrant attention from long-term savers.
Polleit and others describe the global monetary system as fiat-based and structurally prone to inflation over time. Many households and institutions hold large sums in bank deposits that are exposed to negative real returns, fees, and potential institutional risks. Physical gold and silver, by contrast, do not carry counterparty risk and remain accessible without reliance on financial intermediaries — traits that matter to investors seeking durable stores of value.
How Should Investors Allocate Between Gold and Silver?
The practical takeaway from the institutional record and sound-money arguments is straightforward: hold both gold and silver as liquid portfolio assets. The relative weighting should reflect economic conditions — with a higher allocation to gold favored in stable growth environments and relatively larger silver exposure during periods of industrial weakness or deflationary stress. The gold-silver ratio can help guide timing and balance, but it should be considered alongside broader macro and technical analysis.
This approach is not alarmist; it is disciplined, long-term positioning supported by sustained central-bank demand and a renewed institutional focus on reserve diversification.
Stay On Top of Gold & Silver Prices
Receive timely market alerts and concise analysis in your inbox.
SOURCES
1. GoldSilver — Live Gold & Silver Price Charts
2. CME Group — FedWatch Tool
3. World Gold Council — Gold Demand Trends Q1 2026
4. ING Economics — Commodities Research, Ewa Manthey
5. Ludwig von Mises Institute Germany — Thorsten Polleit
Disclaimer: This article is informational only and does not constitute financial or investment advice. Consult a qualified financial adviser before making investment decisions.
You May Also Like:
- Gold at $4,480: Physical Demand Hits a 50-Year Milestone
- Gold Holds $4,481 With Rate-Hike Risk Rising — The NFP Decision Map
- Gold Surges 1.5%: ADP, ISM, and Beige Book Put Pressure on the Fed
- Gold at $4,454: Why Some Say the Fed Is Trapped
- Central Banks Picked Gold Over Treasuries — Should You?
- Central Banks Have Reached a Threshold Not Seen Since 1996
- Factory Costs and What They Mean for Your Gold
- Gold at $4,500: Signals from Fort Knox, China, and Silver
- Silver Has Two Engines — When Stagflation Fires Both
- The List of Gold Buyers Just Got Longer
Popular Topics
Picked from the archive
-
01
 Topics
Why Gold Prices Are Falling Despite Global Turmoil
-
02
Topics
Gold Price Nears $5,000 as Silver Approaches $100
-
03
Topics
Why Investors Are Buying Gold After Today’s Price Drop
-
04
Topics
Barclays’ $4,791 Target Unchanged as Gold Drops 26%
-
05
Topics
5 Signs Gold’s Correction Is a Reset, Not a Reversal
-
06
Topics
GoldSilver: One Account for Home Storage and Secure Vaults
-
07
Topics
Gold Targets Are Falling, but the $8,000 Forecast Holds
-
08
Topics
Gold Fell During War: Is It Still a Safe Haven?