Factory Cost Index Hits 82.1: Why It’s Driving Gold Prices
Key Takeaways
- The ISM Manufacturing Prices‑Paid Index printed 82.1 in May 2026 — marking the 20th consecutive month of rising factory input costs and signaling entrenched input inflation, according to the ISM report released June 1.
- The Federal Reserve faces a policy dilemma heading into its June 16–17 meeting: cutting rates risks credibility amid persistent input inflation, while hiking risks stalling a manufacturing recovery that has only recently returned to expansion.
- Physical gold remained above the $4,460 support level through the session despite a strong labor print, underscoring that the structural case for bullion depends less on a single catalyst and more on a central bank constrained by conflicting economic signals.
Last Monday’s ISM Manufacturing PMI grabbed attention with a headline reading of 54.0, the strongest manufacturing reading since May 2022 and the fifth consecutive month of expansion. New orders and production rose, indicating a genuinely healthy manufacturing sector by this widely followed standard.
Yet the Prices‑Paid sub‑index — the measure of what manufacturers are paying for raw materials and inputs — tells a more concerning story about inflation’s persistence.
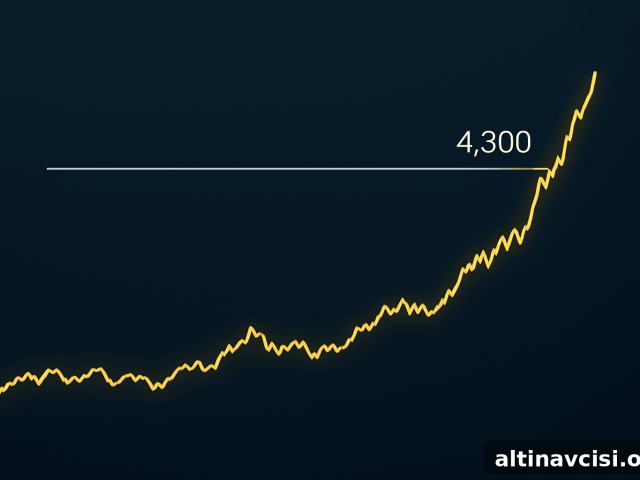
Notably, gold has held above $4,460 across the session. That support level has shown resilience even amid some of the most hawkish labor and inflation data this year, suggesting investor attention on real yields and central bank posture continues to underpin demand for physical metal.
What Is the ISM Prices‑Paid Index Actually Telling Us?
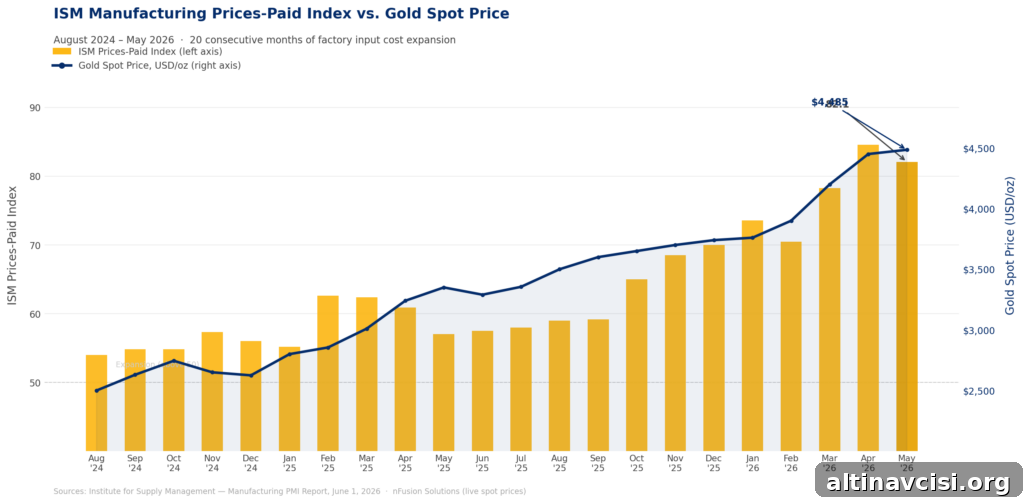
The ISM Manufacturing Prices‑Paid Index registered 82.1 in May 2026, the second‑highest reading since April 2022, according to the ISM Manufacturing PMI report released June 1. The index shows factories are expanding output while simultaneously paying far more for the inputs they require. Three primary drivers cited by respondents explain much of the increase: higher costs for steel and aluminum, tariffs and supply‑chain frictions on imported inputs, and elevated petroleum costs linked to disruptions in the Strait of Hormuz. In May, roughly 42% of manufacturing respondents pointed to the Iran conflict as a direct factor in higher input costs.
Importantly, 82.1 is not an isolated spike; it is part of a persistent trend. The sequence runs March 78.3 → April 84.6 → May 82.1, extending input price pressure to 20 consecutive months. The ISM Services Prices‑Paid Index, which captures costs for roughly 70% of the economy, stood at 70.7 in April and was tied for its highest level since October 2022, with every services industry reporting higher input costs. Together, the surveys point to inflation that is entrenched across both goods and services.
The Edge Every Investor Needs
Smarter precious metals investing starts here. The Nuggets Newsletter delivers timely market analysis, Fed updates, global trends, and educational content tailored to investors who follow gold and silver.
Why Does an 82.1 Prices‑Paid Reading Matter for Gold?
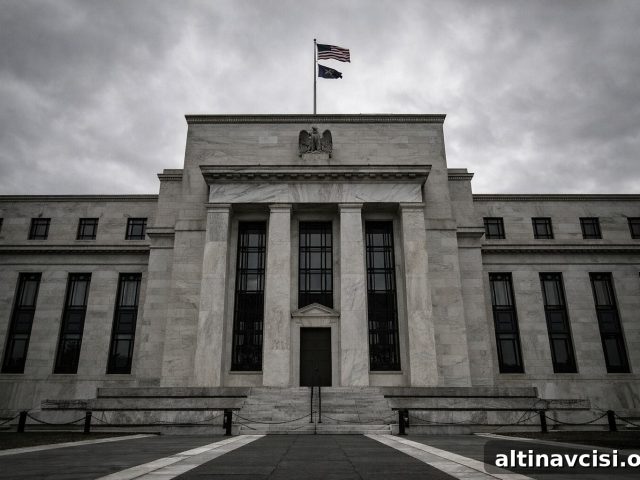
The Federal Reserve meets on June 16–17 for its first session under Chair Kevin Warsh. Markets are pricing a very high probability of no policy change at that meeting, yet they also assign a meaningful chance of a rate hike later in the year. That combination creates a policy bind: the Fed cannot credibly cut rates while input inflation is running at elevated levels like an 82.1 Prices‑Paid reading, and it cannot act aggressively to raise rates without risking the fragile manufacturing recovery just shown by the PMI.
Gold operates outside this policy tug‑of‑war. Whether the Fed holds rates, leaving real yields compressed against a roughly 4.5% PCE baseline, or ultimately hikes and provokes slower growth and stagflation risks, the economics supporting bullion strengthen. Low or negative real yields reduce the opportunity cost of holding physical gold, while slowing growth and persistent inflation increase its appeal as a store of value. In either scenario, the structural case for owning bullion becomes more persuasive.
Why Is This the Environment Sound Money Was Built For?
This environment is not defined by systemic collapse or immediate wartime exigency alone. It is defined by a central bank constrained by competing priorities: preserving purchasing power while not derailing a nascent economic recovery. Savings effectively lose purchasing power at an annualized rate near the PCE baseline. When monetary policy cannot easily reconcile inflation and growth, tangible assets such as physical gold and silver sit outside the policy system and provide a hedge against the erosion of purchasing power. They do not depend on correct policy choices; they depend on an environment where real yields are compressed and inflation pressures persist.
What Does ISM Prices‑Paid at 82.1 Mean for Summer Inflation?
The headline PMI of 54 rightly drew headlines for signaling strong growth, but the Prices‑Paid sub‑index is the forward‑looking inflation signal. Manufacturing input costs today typically feed through into consumer prices over the next three to six months. Therefore, the 82.1 reading in May is likely to show up in CPI and other price measures this summer, precisely when the Fed will be assessing whether inflation has been quashed or merely paused.
ISM Services Chair commentary earlier in the year warned that service sector input costs could remain elevated for months, even in the hypothetical event of a rapid end to geopolitical tensions. With both manufacturing and services price measures elevated, the Fed faces not just a single difficult decision but an extended season of challenging data. That season is part of what has kept the floor under gold at recent levels: a central bank tied to its own arithmetic and unable to deliver a clean resolution to the inflation‑growth tradeoff.
Three Dates to Watch
- June 3 — May ISM Services PMI (10am ET). Focus on the Prices‑Paid component. If it moves up from April’s 70.7 toward the low‑to‑mid 70s, that would indicate manufacturing cost inflation is flowing into services. A surprise decline would be the first clear relief signal in months.
- June 5 — May Nonfarm Payrolls. Recent labor market indicators, including a jump in job openings, make payrolls data critical. A strong jobs print would reduce the Fed’s room to ease and could reinforce the case for higher for longer rates. Watch whether gold holds the $4,460 floor through the release.
- June 16–17 — FOMC meeting under Chair Kevin Warsh. The decision itself may be priced in, but the statement language and the dot plot will provide the Fed’s updated projections for the path of rates in 2026. Those communications will shape market expectations and influence precious metal positioning.
Stay On Top of Gold & Silver Prices
Get important market alerts and timely commentary delivered to your inbox.
Disclaimer: This article is for informational purposes only and does not constitute financial or investment advice. Always consult a qualified financial adviser before making investment decisions.
You May Also Like:
- Gold at $4,500: What Fort Knox, China, and Silver Are Telling You
- Silver Has Two Engines. Stagflation Is the One Condition That Fires Both at Once.
- The Buyer List for Gold Just Got Longer. These Countries Have Never Bought Before.
- PCE Hit 3.8%. GDP: 1.6%. Gold Went Up. Here’s the Mechanism.
- Gold Targets Are Falling. The $8,000 Forecast Isn’t.
- Gold Radar: 5 Stories the Price Chart Isn’t Telling You
- Silver Lost 3.3% While Gold Lost 1.6%. That Gap Is Not Random.
- Gold Down 1.2%, Silver Down 2.8% — The Floor Holds
- UBS Just Cut Its Gold Target by $400. The Part They Kept Is the Real Story.
Popular Topics
Picked from the archive
-
01
 Topics
What the Fed’s 3-Day Silence Means for Gold Prices
-
02
Topics
Gold Jumps to $4,746 as Oil Crashes: Why Investors Are Bullish
-
03
Topics
How Government Debt Drives Gold and Silver Prices
-
04
Topics
Can Gold Hold at $4,300? Price Outlook for Investors
-
05
Topics
Why Gold and Oil Move Opposite and What It Means for Investors
-
06
Topics
Gold and Silver Prices: Short-Term Volatility, Long-Term Trend
-
07
Topics
Wholesale Prices Jump Most in 3 Years as Tariffs Hurt US Economy
-
08
Topics
Why Silver Jumped 6% Before Trump Xi Summit