Why Investors Are Buying Gold After Today’s Price Drop
In today’s update: The day’s gold pullback reflects oil and Fed concerns tied to the U.S.–Iran conflict, even as long-term demand remains strong — central banks purchased a net 244 tonnes in Q1 2026, Goldman Sachs maintains a $5,400 year-end target, and Asian ETF inflows set new records. Short-term noise and long-term signals are diverging; here’s what that means for investors.
Gold dipped today as rising oil prices and renewed inflation worries made the Federal Reserve’s hawkish stance more likely, triggering forced liquidations on COMEX. At first glance the move looks alarming, but a broader perspective tells a different story. Major institutions and central banks continue to accumulate physical gold and long-term ETF holdings are near historic levels. That contrast — short-term selling driven by leverage and headlines versus methodical, long-term buying — creates buying opportunities for patient investors.
Why Is the U.S.-Iran War Pushing Gold Lower?
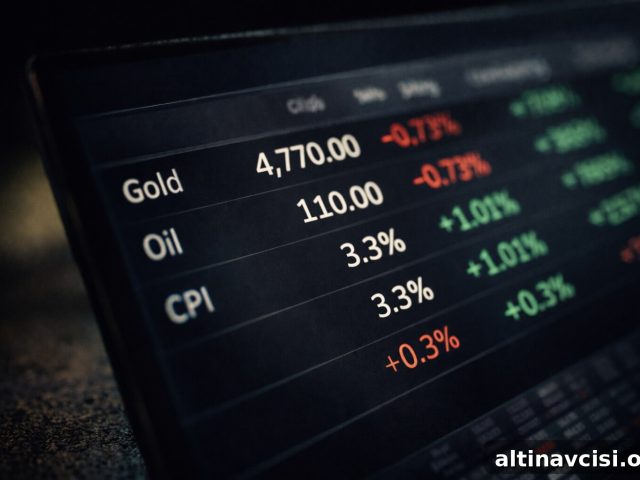
On Monday, May 26, gold slid from around $4,580 to roughly $4,505 after the U.S.–Iran conflict lifted oil prices and raised the odds that the Fed will remain hawkish. Higher oil costs tend to feed headline inflation, giving central banks cover to keep interest rates elevated. In the short term, rising real yields and a firmer dollar make yield-bearing assets relatively more attractive than gold, pressuring prices. Still, the decline was a modest 1.6% from the intraday peak, and gold found support near $4,500. Despite ongoing geopolitical tension through May, prices have not closed below the roughly $4,490 area — a sign that selling is testing but not breaking the market’s floor.

The Edge Every Investor Needs
Smarter precious-metals investing begins with timely, clear insights. Subscribe to concise market updates that cover central bank activity, ETF flows, geopolitical drivers, and practical investing perspective.
Goldman Sachs Is Targeting $5,400. Why Is Central Bank Demand the Foundation?
On May 25, Goldman Sachs reiterated its bullish outlook, keeping a $5,400 per ounce year-end target for 2026. The bank’s core thesis centers on central bank behavior: official institutions are shifting reserve allocations away from dollar assets and toward gold in a measured, structural way. This buying is largely price-insensitive — meaning central banks are prepared to continue accumulation even as prices rise. Geopolitical uncertainty only strengthens the case for diversification. The takeaway: the largest, most patient buyers remain committed, and private holders of physical gold are aligned with that long-term demand base.
Central Banks Bought 244 Tonnes in Q1. The Fed Was Hawkish the Entire Time. Why?
The World Gold Council reported that central banks added a net 244 tonnes of gold in Q1 2026, the fastest official-sector accumulation in more than a year. That continued buying occurred despite headwinds: a hawkish Federal Reserve, rising real yields, and a stronger dollar — all conventional bearish signals for gold. The fact that central banks kept accumulating shows they are prioritizing strategic reserve diversification over short-term price moves. These institutions operate with long time horizons and deep information sets. Their sustained purchases are a powerful structural signal that underpins gold’s price floor over time.
Asia Is Now Driving Gold ETF Inflows. North America Sold. What Does That Signal?
ETF holdings reached an all-time high of 4,145 tonnes in January 2026 and remain elevated. The composition of demand has shifted: North American investors led past inflows, but in Q1 2026 Asia became the dominant source of sustained buying. China, in particular, accounted for much of the regional increase as investors sought safe havens amid weaker local equities and a softer yuan. Asian-listed funds added a record 84 tonnes during the quarter, while North American funds experienced net outflows in March. Historically, ETF interest often precedes a move from paper exposure to physical metal, making these Asian inflows an important indicator of durable demand.
COMEX Forced Liquidations Are Driving This Dip. Here’s What Happened Last Time.
The recent drop in gold has been amplified by heavy COMEX futures liquidations. Margin calls force leveraged positions to unwind quickly, often without regard for price, which creates temporary downward pressure that can push spot prices below the level justified by fundamentals. The clearest precedent was March 2020, when forced selling drove gold down sharply — only for the metal to rebound significantly in the following months as structural buyers held their positions. That episode illustrates how transient liquidation-driven declines can be, and why patient buyers who aren’t forced to sell often benefit from these dislocations.
The Divergence Is the Signal
Across these developments a single theme emerges: short-term price pressure and long-term accumulation are moving in opposite directions. Headlines tied to geopolitical events can nudge gold by small daily percentages, while large-scale, persistent buying by central banks and Asian investors changes the structural supply-demand balance. That divergence creates opportunities for disciplined investors who distinguish between noise and signal. A drop to roughly $4,505 on a day marked by forced liquidations and hawkish Fed fears is not necessarily a turning point — it can be a temporary discount relative to the broader trend. When major institutions and official buyers continue to accumulate, short-term dips can offer attractive entry points for those focused on the long horizon.
Stay On Top of Gold & Silver Prices
Receive concise market alerts delivered to your inbox.
SOURCES
1. World Gold Council — Gold Demand Trends Q1 2026
2. World Gold Council — Gold ETF Holdings and Flows, January 2026
3. Yahoo Finance — Coverage of Goldman Sachs’ gold outlook and central bank buying forecasts
4. World Gold Council — Gold ETF Holdings and Flows, March 2026
5. World Gold Council — Investment Update: Gold Prices Swing as Markets Sell Off
6. nFusion Solutions — Live spot price data provider
Disclaimer: This article is for informational purposes only and does not constitute financial or investment advice. Consult a qualified financial adviser before making investment decisions.
You May Also Like:
- Silver Up 3%. Gold Up 1.3%. The Ratio Tells You Everything.
- Iran News Sent Gold Price Both Ways. The Driver Was Never Iran.
- Gold Falls 0.5% on Iran Deal: The Floor Holds.
- Is Gold Being Repriced? Five Major Institutions Say Yes.
- Silver Dropped 12%. Gold Dropped 3%. That Gap Is the Story.
- Gold Won’t Break — The Fed Just Told You Why.
- Why London Still Sets the Gold Price — and Asia Doesn’t.
- Gold Price at ~$4,502: Is the Dip a Buy? BofA Says $6,000.
Popular Topics
Picked from the archive
-
01
 Topics
5 Factors Driving Gold and Silver Prices Higher
-
02
Topics
US Treasury Yields Rise Ahead of Major Bond Auction
-
03
Topics
Gold Price Volatility Back to COVID-Era Levels
-
04
Topics
Gold Price Nears $3,700 Ahead of Fed Meeting
-
05
Topics
CPI 3.3% and GDP Stalling: Is 2026 Stagflation Coming?
-
06
Topics
Dollar Drops as Markets Price In Fed Cuts; Tariff Fears Rise
-
07
Topics
Why Turkey Sold Its Gold and What It Means for Sound Money
-
08
Topics
Gold Price Forecast: Oil Futures Diverge From Stocks