April Jobs Beat 115K: Why Gold Held While Dollar Fell
Gold and silver market update — May 8, 2026
Key Takeaways
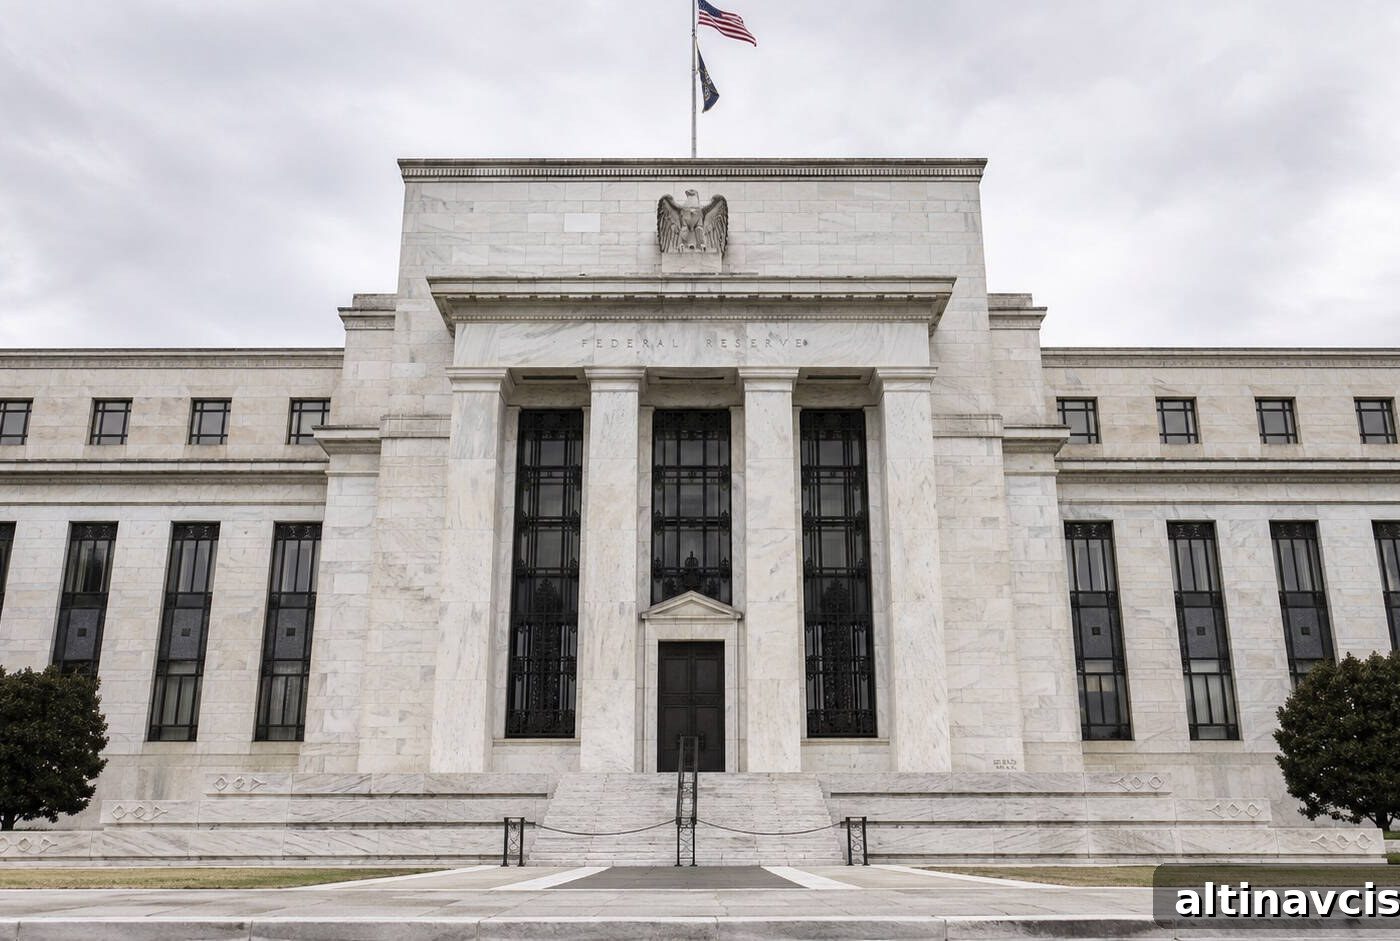
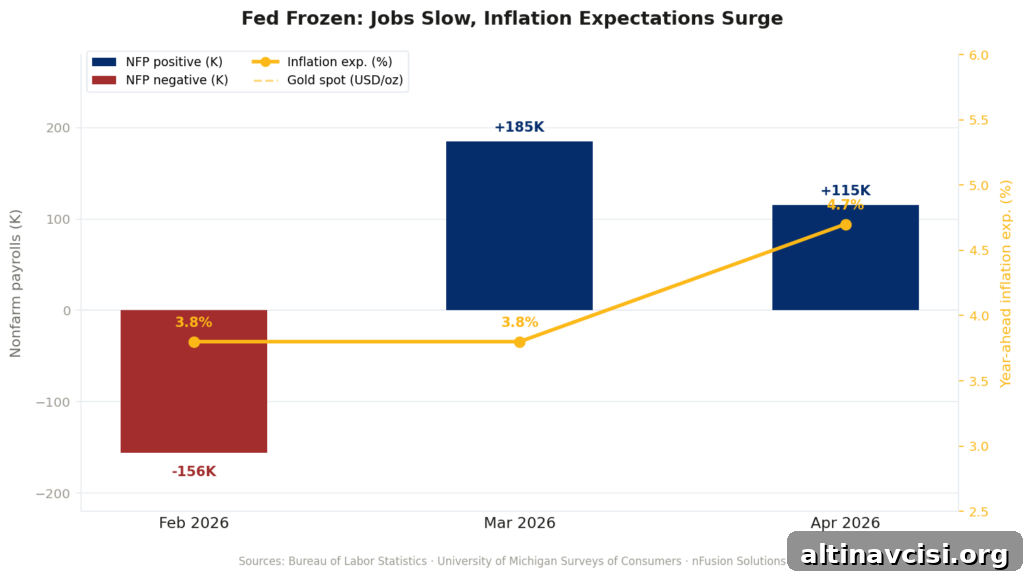
- April 2026 nonfarm payrolls rose by 115,000, more than double the Dow Jones consensus of 55,000, yet gold remained above $4,700 while the US dollar weakened. Average hourly earnings grew only 0.2% month-over-month, below the 0.3% forecast (BLS, May 8, 2026), leaving the Federal Reserve unable to aggressively raise rates and reluctant to cut.
- The University of Michigan’s May preliminary survey showed year-ahead inflation expectations at 4.5%, only marginally lower than April’s 4.7%. These expectations sit well above the Fed’s policy rate of 3.50–3.75%, implying negative real returns for cash and sustained demand for alternative stores of value.
- CME FedWatch implied a June rate hold probability above 95%. Central banks had been net buyers of gold for 18 straight months as of April 2026. A Fed that is effectively stuck — unable to hike nor cut — is a clear structural tailwind for precious metals.
On May 8, 2026, the US economy added 115,000 nonfarm payrolls in April, surprising the market to the upside. Despite the stronger headline print, gold barely budged and the dollar weakened—an unusual reaction that highlights market concerns about Federal Reserve credibility and the outlook for inflation and real interest rates.
Gold spot price: $4,723 (approx. 3:21 PM ET, source: nFusion Solutions), up roughly 0.8% on the day.
Why gold held its ground after a strong jobs report: The jobs beat was meaningful, but the details mattered. Average hourly earnings rose only 0.2% month-over-month, missing consensus, and year-over-year wage growth cooled to 3.6% (BLS). This suggests payroll gains are not generating a wage-driven inflationary surge. At the same time, consumer inflation expectations remain stubbornly high: the University of Michigan’s May preliminary survey shows year-ahead expectations at 4.5% (April finalized at 4.7%). With inflation expectations well above the Fed’s policy rate, the central bank faces a policy trap: cutting risks cementing elevated expectations, while hiking risks damaging a labor market described by the BLS as showing “little net change over the prior 12 months.”
The Edge Every Investor Needs
Smarter precious metals investing starts here. The Nuggets Newsletter delivers concise market analysis, Fed updates, global trends, and educational content.
What Did the April 2026 Jobs Report Actually Show?
The Bureau of Labor Statistics reported 115,000 nonfarm payrolls added in April at 8:30 AM ET. This exceeded the Dow Jones consensus of 55,000 and the Reuters-tracked median of 62,000. March’s payrolls were revised up to 185,000. The unemployment rate held at 4.3%. Job gains were concentrated in healthcare (+37,000), transportation & warehousing (+30,000), and retail trade (+22,000), while the federal government shed about 9,000 positions. As the BLS noted, the overall trend in employment reflected “little net change over the prior 12 months.”
The key datapoint for policy was wages: average hourly earnings rose 0.2% month-over-month, below the 0.3% consensus and signaling cooling wage pressure. That combination—solid payrolls but soft wages—means the economy is adding jobs without feeding a wage-price spiral. Without accelerating wage inflation, the Fed lacks a clear justification to tighten further, and elevated inflation expectations make easing politically and economically risky.
At 10:00 AM ET, the University of Michigan’s preliminary May Consumer Sentiment survey showed year-ahead inflation expectations at 4.5%, down slightly from April’s 4.7% finalized reading. Long-run expectations held at 3.5%, the highest level since October 2025. These readings underscore consumer concerns about persistent inflation and weigh on monetary policy decisions.
Why Did the Dollar Fall on a Strong Jobs Report?
The market reaction reflects a broader concern: the Fed appears trapped between two risks. Cutting rates now risks entrenching higher inflation expectations (4.5–4.7% year-ahead), while hiking risks damaging a labor market that has shown only modest net change over the past year. Soft wage growth removes the traditional justification for tightening. As a result, traders priced a very high probability of a policy hold in June, and the dollar weakened as the market shifted focus from payroll strength to the Fed’s limited policy options. EUR/USD and GBP/USD gained on the session while gold held its gains.
What Are Markets Pricing for the Fed’s June 17 Meeting?
CME FedWatch already showed a very high probability of a June rate hold before the April payrolls, and the stronger-than-expected NFP print only reinforced that view. Analysts surveyed by Reuters placed the 2026 average gold price forecast near $4,916, up from $4,746 three months earlier. Gold is up substantially year-over-year, reflecting a mix of fiscal deficits, energy-related inflation pressures from geopolitical conflict, and a central bank that cannot clearly claim victory on either inflation or employment.
What Does Fed Paralysis Mean for Physical Gold and Silver Investors?
When consumers expect inflation well above policy rates, real returns on cash become negative. That situation historically drives demand for assets outside the monetary system—physical gold and silver among them. Central banks purchasing gold for 18 consecutive months through April 2026 indicates institutional demand is aligned with consumer behavior. That combination creates a durable structural floor under precious metals prices, independent of short-term geopolitical headlines.
Is This a Temporary Spike or a Structural Shift in Gold’s Floor?
The persistence of elevated inflation expectations—4.7% in April, 4.5% preliminary in May—points to an erosion of confidence in traditional monetary anchors. Years of inflation above initial Fed projections, combined with renewed energy volatility from international conflict, have shifted both institutional and retail expectations. With consecutive months of central bank gold purchases and rising retail interest, the current price environment looks more like a structural re-rating of gold’s floor than a fleeting spike.
What to Watch Next
Key upcoming data: April CPI on Tuesday, May 12, and April PPI on Wednesday, May 13. Elevated readings in either release would reinforce gold’s support above $4,700 and strengthen the case for continued demand in physical precious metals.
Stay On Top of Gold & Silver Prices
Receive market alerts and concise updates directly to your inbox.
SOURCES
1. Bureau of Labor Statistics — The Employment Situation, April 2026
2. U.S. Bureau of Labor Statistics — CPI Release Schedule 2026
3. U.S. Bureau of Labor Statistics — PPI Release Schedule 2026
4. University of Michigan Surveys of Consumers — May 2026 Preliminary Results
5. CME Group — CME FedWatch Tool
6. Federal Reserve — FOMC Statement, April 28–29, 2026
7. Reuters — Gold Price Analyst Survey, 2026
8. World Gold Council — Gold Demand Trends, Q1 2026
9. nFusion Solutions — Metals Spot Price API, May 8, 2026
10. TradingEconomics — Gold Spot Price, May 8, 2026
Disclaimer: This article is for informational purposes only and does not constitute financial or investment advice. Always consult a qualified financial adviser before making investment decisions.
You May Also Like:
- Jobs Beat, Ceasefire, Deficit: What It Means for Gold
- Gold Price Outlook: Oil Futures Disagree With Stock Markets
- Why Silver Hit $82 Today: Iran, Oil, and the Fed
- Gold Hits $4,746 as Oil Crashes. Here’s Why That’s Bullish
- Gold Price and Nonfarm Payrolls: Why the Fed Is Trapped
- Gold Is Decoupling From Geopolitics. Here’s the Proof
- The Fed Is Frozen. The Debt Is Growing. Gold Is Watching.
- Gold Jumps on Iran Deal Hopes. The Real Driver Is the Fed
Popular Topics
Picked from the archive
-
01
 Topics
Why Metals Led Markets in 2025 and What It Means for 2026
-
02
Topics
Wall Street Whiplash: Stocks Rally on CPI, Plunge on PPI Shock
-
03
Topics
US Treasury Yields Rise Ahead of Major Bond Auction
-
04
Topics
Markets Slash ECB Rate-Cut Odds After Trade Deal Eases Tariff Fears
-
05
Topics
3 Questions Investors Must Ask Before Buying Any Asset in 2026
-
06
Topics
Gold vs Cash: How Inflation Destroys Dollar Purchasing Power
-
07
Topics
U.S. Gas Prices Fall to 12-Month Low Despite Heat; Storage Up 6%
-
08
Topics
Gold Price 3,767 USD: Fed Rift Deepens as China Eyes Share