Gold Rally Driven by Fed Policy, Not Iran Deal Hopes
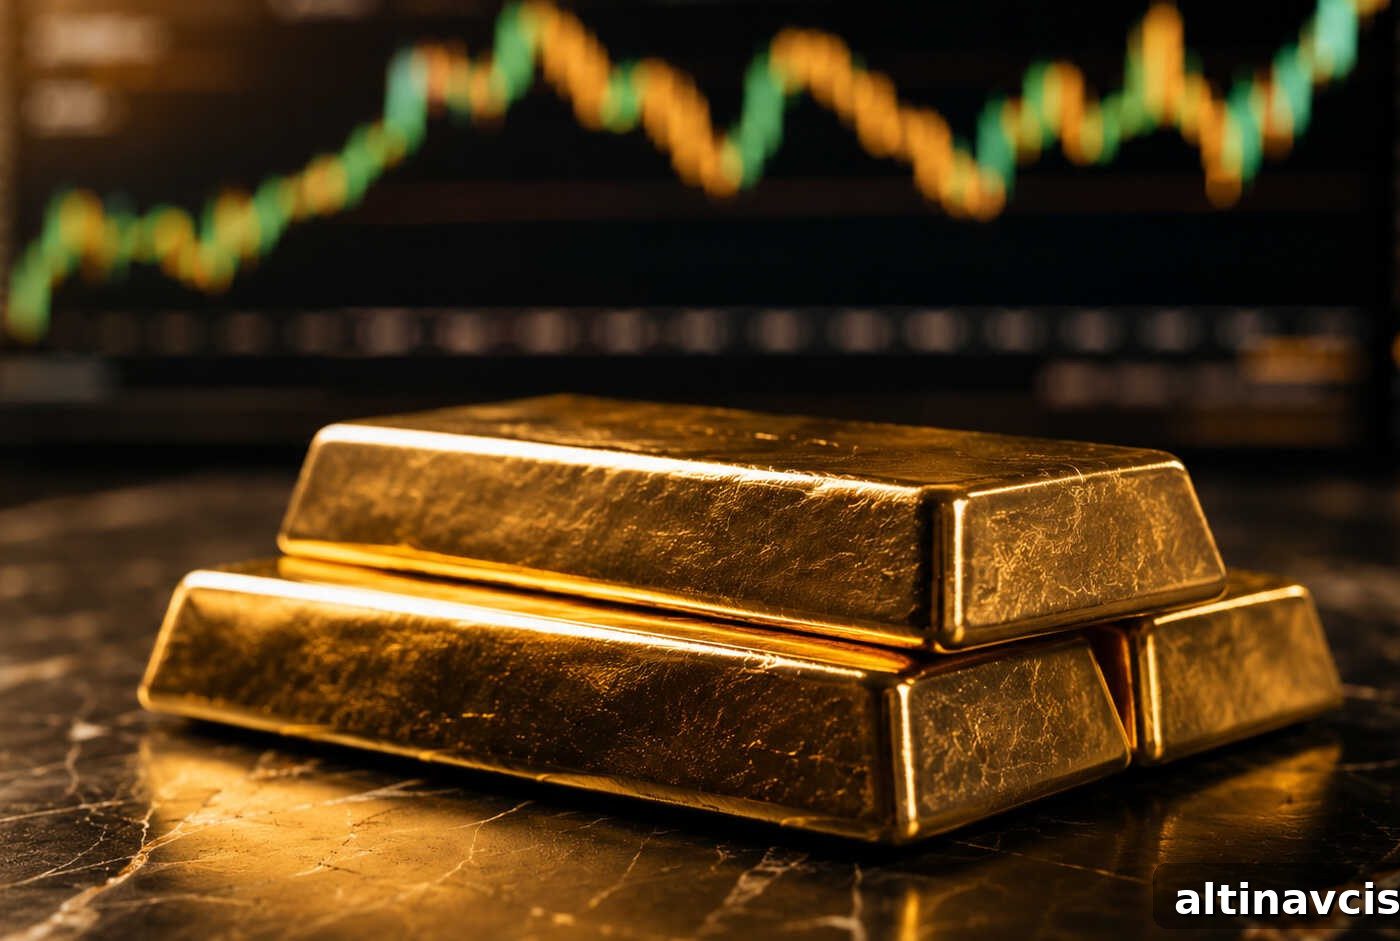
Gold and silver market update — May 6, 2026
Key Takeaways:
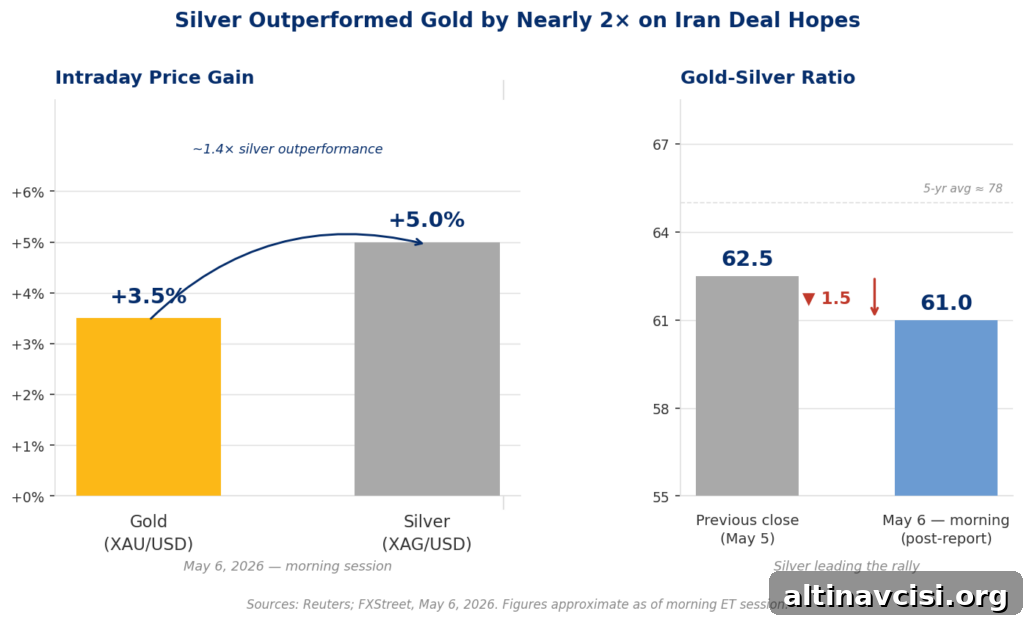
- On Wednesday, May 6, 2026, gold climbed roughly 3.5% toward $4,700 per ounce and silver rose about 5% to near $76–$77 after Axios reported the White House believes it is close to a one-page memorandum with Iran, with an Iranian response expected within 48 hours.
- This move is not primarily a classic safe-haven surge. Markets appear to be pricing out the inflation channel that had frozen the Federal Reserve’s ability to cut rates: closed Strait of Hormuz → higher oil → higher PCE inflation → no Fed cuts. A reopening reverses that chain. Silver outperformed because a deal would restore both its monetary and industrial demand drivers at once.
- The memorandum is not signed and several earlier peace signals have reversed. Major banks’ year-end gold targets — such as Goldman Sachs at $5,400 and JPMorgan at $6,300 — depend on that inflation relief arriving. Watch Iran’s 48-hour response window and Friday’s U.S. jobs report for confirmation.
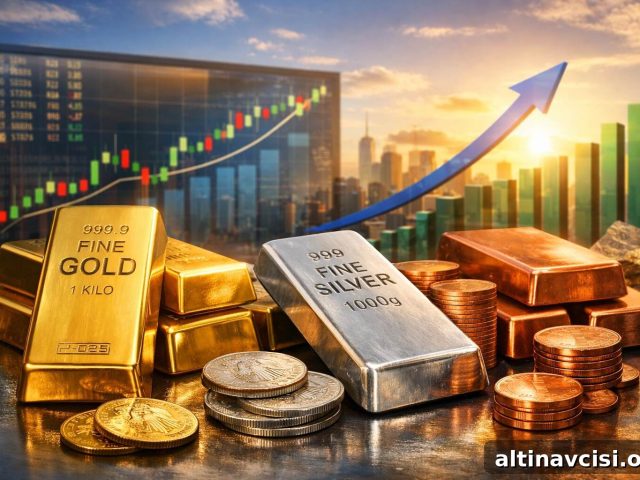
Silver rallied about 5% Wednesday morning, May 6, 2026, reaching roughly $77 per ounce, while gold approached $4,700 and traded near $4,690 by mid-morning Eastern Time. The immediate trigger was a report that the White House believes it is close to a one-page peace memorandum with Iran, and that Tehran is expected to respond within 48 hours. The markets reacted quickly.
Many outlets described this as a “peace trade.” That label is accurate but incomplete. Gold and silver rose not because investors were suddenly seeking safety, but because the primary factor that had been suppressing both metals — inflation driven by disrupted oil flows — may be easing.
Why Is Gold Rising When Peace Should Hurt It?
A typical de-escalation reduces the safe-haven premium and so would tend to lower gold. This time is different because the conflict’s economic fallout — primarily higher energy prices — had trapped gold by keeping inflation elevated and withholding the Fed’s ability to cut rates.
When Iran’s actions closed the Strait of Hormuz earlier in the year, oil briefly rose above $100 per barrel. That spike helped push the Personal Consumption Expenditures (PCE) inflation measure from 2.8% in February to 3.5% in March, the highest in nearly three years. At the same time, ISM Manufacturing Prices Paid surged, reflecting strong input-cost pressures. Those readings reduced expectations that the Fed could ease policy; markets priced only a slim chance of a June cut and real yields remained high. Because gold is a non-yielding asset, elevated real yields weighed on its price.
A diplomatic step that eases pressure on oil changes this dynamic. With the Axios report, oil prices fell sharply, which would lower PCE inflation in coming months and give the Fed latitude to cut rates. Rate reductions tend to compress real yields, and lower real yields have historically powered major gold rallies. In short, peace would remove the inflation-driven constraint and restore a key driver for higher gold prices.
Why Is Silver Outperforming Gold Today?
Silver’s roughly 5% gain nearly doubled gold’s move, and that outperformance is meaningful because silver benefits from two distinct demand engines.
First, the monetary channel mirrors gold’s response: lower energy-driven inflation increases the likelihood of Fed rate cuts, which supports precious-metals prices broadly. Silver tends to track gold closely along this path.
Second, silver has a larger industrial component to its demand profile. Two months of Hormuz disruption raised energy costs, forced supply-chain adjustments and reduced some manufacturing output. That dented industrial silver demand. The Silver Institute projected a continued annual silver deficit for 2026, and a reopening of Hormuz would not only lower oil but also revive industrial activity that drives a substantial share of silver consumption. Both the monetary and industrial engines firing at once explains why silver led this session’s rally and pushed the gold-silver ratio down from about 62.5 to roughly 61 in a single trading day.
If a Deal Is Signed, What Happens to Gold’s Ceiling?
Major sell-side forecasts that were set before the conflict — for example, Goldman Sachs’ $5,400 year-end target and JPMorgan’s $6,300 target — have remained intact despite the war. Those projections were based on the view that the Fed’s inflation constraint was temporary and that rate cuts would arrive later in the year. The conflict extended that headwind but did not invalidate the underlying thesis.
A stable Strait of Hormuz and lower oil would cool PCE inflation toward a mid-range of roughly 2.5–3% over the next two to three quarters. That would give the Fed room to reduce rates, compress real yields and reopen the $5,400–$6,300 implied trading band sometime in 2026. Analysts who recently noted $5,000–$5,500 as a plausible year-end range under normalization are simply describing what the base case looks like once the primary headwind is removed.
What Should You Watch in the Next 48 Hours?
Axios’s 48-hour window runs through Thursday night, which puts any Iranian response one day before Friday’s U.S. nonfarm payrolls report. Consensus for the jobs print is near 53,000 new jobs, well below March’s pace. Watch three key signals: whether Iran publicly confirms it is reviewing or responding to specific terms; whether oil prices hold under $105 per barrel; and whether Friday’s NFP shows meaningful labor-market softening. A weak payrolls print plus a live diplomatic breakthrough and falling oil would create one of the most supportive environments for gold since January.
The deal is not finalized, and past peace signals have reversed, so any rally can retrace. Still, the market’s framing has shifted: the central question is no longer simply “when will the inflation trap lift?” but “is this the turning point?” That is a materially different starting position for gold and silver investors.
SOURCES
1. Axios — Exclusive reporting on a U.S.-Iran one-page memorandum
2. Reuters via CNBC — Coverage of gold’s move after Middle East peace hopes and dollar weakness
3. FXStreet — Silver price coverage for May 6, 2026
4. UPI — Reporting on related geopolitical developments
5. Jerusalem Post — Reporting on regional military or political shifts
6. Silver Institute — World Silver Survey 2026 and supply-demand context
7. International Energy Agency — Analysis of the Middle East and global energy markets
8. U.S. Bureau of Economic Analysis — Personal Income and Outlays, March 2026 (PCE data)
9. Institute for Supply Management — ISM Manufacturing data, including Prices Paid series
Disclaimer: This article is for informational purposes only and does not constitute financial or investment advice. Always consult a qualified financial adviser before making investment decisions.
You May Also Like:
- What the IMF’s Inflation Forecast Shift Means for Gold
- What’s Really Driving Gold Prices Today — 5 Key Signals
- Gold Price and the Jobs Report: A Pre-Market Guide
- The Gold-Silver Ratio Is Expanding — and Being Misread
- Gold, Silver, and Stagflation: 5 Signals That Matter Now
- Why Gold Fell on the Hormuz Tanker Strike
- WGC Q1 2026: What Asia Knows That Wall Street Doesn’t
- BEA Stripped Silver From GDP. Here’s What It Means
Popular Topics
Picked from the archive
-
01
 Topics
Why Metals Led Markets in 2025 and What It Means for 2026
-
02
Topics
Wall Street Whiplash: Stocks Rally on CPI, Plunge on PPI Shock
-
03
Topics
US Treasury Yields Rise Ahead of Major Bond Auction
-
04
Topics
Markets Slash ECB Rate-Cut Odds After Trade Deal Eases Tariff Fears
-
05
Topics
3 Questions Investors Must Ask Before Buying Any Asset in 2026
-
06
Topics
Gold vs Cash: How Inflation Destroys Dollar Purchasing Power
-
07
Topics
U.S. Gas Prices Fall to 12-Month Low Despite Heat; Storage Up 6%
-
08
Topics
Gold Price 3,767 USD: Fed Rift Deepens as China Eyes Share