Gold Price Falls to $4,681 as Iran Ceasefire Ends Today
Gold and silver market update — April 21, 2026
Key Takeaways
- Gold is trading at $4,680.96 as of April 22, 2026, down roughly 10–12% since the Iran war began on February 28. The decline reflects a counterintuitive dynamic: energy-driven inflation increases the pressure on central banks to tighten policy, which weighs on non-yielding assets like gold.
- The US–Iran ceasefire expires today. The U.S. has indicated it will not extend the ceasefire without a negotiated deal. Iran has not confirmed renewed talks. Two plausible price scenarios are described below depending on whether hostilities resume or de-escalate.
- Kevin Warsh’s Fed nomination is stalled in the Senate Banking Committee. Senator Thom Tillis is blocking committee action until the Department of Justice drops its investigation into Chair Jerome Powell — creating a leadership vacuum at the Fed ahead of Powell’s May 15 term expiration.
- Silver is trading near $74–$79 per ounce, down more than 15% since the conflict began. Silver’s stronger industrial demand makes it more exposed to the energy shock and more sensitive to any genuine de-escalation.
- Major banks still target materially higher year‑end gold prices. JPMorgan and Deutsche Bank published targets near $6,300 and $6,000 per ounce, respectively, before the current Fed leadership uncertainty emerged; those structural projections have not been publicly withdrawn.
The US–Iran ceasefire ends today. The next Federal Reserve chair remains unconfirmed. Gold — down roughly 10–12% since the conflict began — is signaling more than simple panic or a permanent reversal. The price action reflects a specific market mechanism that many headlines have missed.
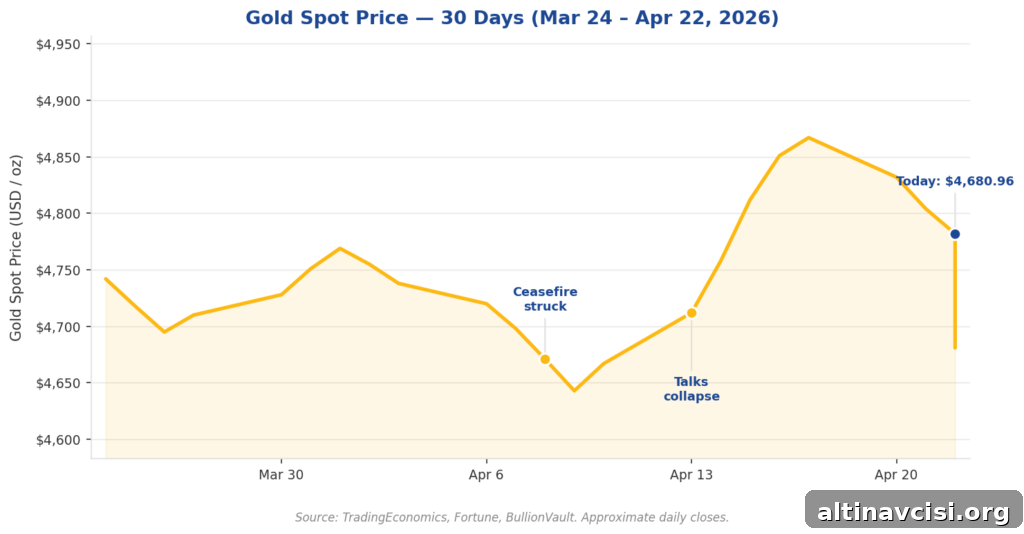
As of April 22, 2026, gold is trading at $4,680.96, slipping from the $4,750–$4,900 sessions it held recently and well below the all‑time high of $5,595 reached on January 29. At the same time, Brent crude has returned toward $95–$97 per barrel and the 10‑year U.S. Treasury yield sits near 4.25% — a combination that matters for precious metals.
Why Is Gold Falling During a Middle East War?
Investors naturally expect gold to rally during geopolitical risk events. This time the response has been different because of how the oil shock feeds directly into inflation and monetary policy expectations.
When conflict pushes oil prices higher, inflation expectations rise. Higher expected inflation increases the probability that central banks will tighten policy to contain it. Tighter policy generally boosts real yields — the inflation‑adjusted returns on bonds — and higher real yields raise the opportunity cost of holding gold, which pays no interest. That dynamic has been the dominant force in recent weeks.
After strikes involving Iran began on February 28, gold initially spiked from about $5,100 to above $5,296. But as oil surged and market participants priced in more aggressive central bank action, the dollar strengthened and yields climbed. Traders prioritized those bearish fundamentals over the so‑called safe‑haven bid, which produced the selloff in gold and other non‑yielding assets.
Importantly, gold did not collapse into freefall. It found a trading range and held it for several weeks — a stabilization that matters because it suggests the market is sorting through two competing forces: geopolitical risk pushing prices up and tighter monetary expectations pushing them down.
What Does the Ceasefire Expiration Mean for Gold?
The ceasefire negotiated on April 8 briefly lifted risk sentiment and sent gold toward $4,850–$4,867 while oil dipped below $100 per barrel. That respite was short‑lived: tensions flared again, the Strait of Hormuz has been intermittently closed, and naval incidents have raised the risk premium for oil transport. Despite this, gold remained range‑bound until renewed selling pressure appeared.
Two clear scenarios are in play as of April 22:
- Ceasefire holds or talks resume: Oil prices would likely ease, near‑term inflation expectations could fall, and a recovery toward $5,000 becomes increasingly plausible. The recent pullback might be viewed in hindsight as a buying opportunity.
- Hostilities escalate and shipping disruptions persist: Oil could spike again, inflation fears would intensify, and the Fed would face stronger incentives to tighten — a mix that could keep near‑term gold prices under pressure even as the long‑term case for physical gold strengthens.
Macro data reinforce the tension. The IMF’s April 2026 World Economic Outlook projects global headline inflation of 4.4% for 2026 and global growth near 3.1%, figures that reflect the ongoing energy shock. With the federal funds rate at 3.50–3.75% and major market tools pricing near‑zero probability of cuts this year, the market has already baked in a tighter‑for‑longer Fed. That leaves any additional Middle East shocks to interact with an already hawkish expectations backdrop.
What Did Kevin Warsh Say at His Fed Hearing?
Kevin Warsh testified before the Senate Banking Committee on April 21 as President Trump’s nominee to replace Jerome Powell. His testimony added structural uncertainty: Warsh denied being pre‑committed to lower rates and proposed a “new framework” for persistent inflation without detailed policy steps, urging the Fed to remain independent and “stay in its lane.”
More consequential for markets is that his confirmation is now stalled. Senator Thom Tillis is blocking committee action until a Justice Department investigation into Chair Powell is dropped. That probe — centered on the Fed’s headquarters renovation and previously criticized by a federal judge for lacking evidence — remains unresolved and keeps the Fed leadership in limbo as Powell’s term approaches its May 15 expiry.
Why Is the Fed Chair Confirmation Fight Bullish for Gold?
When Warsh was first nominated in January, gold dropped roughly 9–11% on the day as markets interpreted the pick as hawkish and indicative of a weaker “Fed put.” Since then, the market has partially recovered. Today’s uncertainty — no confirmed successor, an investigation into the current chair, and no commitment to easing policy — underscores a risk that monetary policy will remain restrictive. That structural policy uncertainty tends to support demand for physical assets with no counterparty risk.
What Physical Gold Offers That the Fed Cannot
Physical gold carries no counterparty exposure, no governance disputes, and no dependence on a central bank confirmation process. That tangible, non‑financial nature is a key reason major banks continue to publish lofty year‑end targets: JPMorgan raised a $6,300 target in February 2026 and Deutsche Bank reiterated a $6,000 target in January. Those estimates reflect structural drivers — inflation, central bank balance sheets, and long‑term currency depreciation — that remain in place.
What Is the Gold-to-Silver Ratio Telling Us?
Silver peaked with gold on January 29 at a nominal high of $121.67 per ounce and has since fallen more than 15%, trading near $76–$79 as of April 21. The gold‑to‑silver ratio sits around 63 as of April 22 — reflecting gold at $4,681 and silver near $74. Historically, a ratio above 70 has often signaled that silver is undervalued relative to gold and has preceded periods of silver outperformance, while levels below 50 reflect strong silver strength. The current ratio suggests there is room for silver to catch up if conditions improve.
Why Is Silver Underperforming Gold Right Now?
Silver’s price action is more exposed to industrial demand: roughly 60% of annual silver consumption is industrial. Higher oil prices raise production and transport costs, weighing on manufacturing activity and industrial metal demand. That makes silver more vulnerable to an energy shock than gold. Conversely, if a real ceasefire reduces oil prices, silver would likely recover faster and more sharply than gold because its industrial demand component would rebound.
The Structural Case Hasn’t Changed
A near‑term drawdown to $4,681 — about 16% below January’s peak — is noise relative to the structural drivers that support higher precious metal prices over time. The IMF’s inflation outlook, a Fed facing inflation and a large balance sheet, and a dollar with long‑run purchasing‑power challenges all point to continued interest in physical gold and silver as portfolio diversifiers and stores of value.
Short‑term outcomes will follow the ceasefire and oil price path. Over the medium to long term, the same structural forces that led major banks to publish $6,000–$6,300 targets remain present. Gold’s recent decline reflects where it trades today, not where its structural case stands.
Stay On Top of Gold & Silver Prices
Receive concise market alerts and analysis straight to your inbox.
SOURCES
1. TradingEconomics — Gold Spot Price
2. Fortune — Current Price of Gold, April 20, 2026
3. CNBC — Gold Nears $5,600 as Safe‑Haven Rush Intensifies, Silver Blazes Past $120
4. Fortune — Current Price of Silver, April 21, 2026
5. Silver Institute — Global Silver Investment to Remain Strong in 2026
6. CNBC — Gold on Track for Worst Month Since 2008 as Iran War Drags On
7. CNBC — Gold Falls as Markets Assess Prospects of Iran Ceasefire
8. IMF — World Economic Outlook, April 2026
9. CME Group — FedWatch Tool
10. CNBC — Kevin Warsh Fed Confirmation Hearing coverage
11. NPR — Key takeaways from the Warsh confirmation hearing
12. Federal Reserve press releases and public records
13. J.P. Morgan Private Bank analysis on gold outlook
14. Reuters reporting on Deutsche Bank’s gold forecast
15. Contemporary news coverage and public reporting on the 2026 Iran conflict
By the GoldSilver Editorial Team — helping investors understand sound money since 2005. This article is for informational purposes only and does not constitute financial, investment, or tax advice. Always consult a qualified financial advisor before making investment decisions.
You May Also Like:
- Tariff Refunds, Dollar Weakness, the AI Bust: Gold’s Case
- The Real Reason Gold Is Down During an Oil War
- What the Warsh Hearing Means for Gold Prices
- IMF Says Treasuries Aren’t Safe Anymore. Gold Noticed First.
- Gold Price After Ceasefire Violation: The Floor Has Moved
- Oil Crashed 11%. Gold Went Up. That Tells You Everything.
- $1 Trillion in Debt Interest Is Why Gold Keeps Climbing
- 5 Signals That Say Gold’s Bull Case Just Got Stronger
Popular Topics
Picked from the archive
-
01
 Topics
How Gold Prices Move During a US Dollar Crash
-
02
Topics
BEA Removed Silver From GDP: What It Means
-
03
Topics
Gold Prices Slip as Kremlin Hints at Ukraine De-escalation
-
04
Topics
Silver Price Tops $50 for First Time Since 1980
-
05
Topics
Gold and Silver Prices Jump Amid Strait of Hormuz Tensions
-
06
Topics
Gold Prices Up 21%, Silver 25% YTD Amid AI and Inflation Fears
-
07
Topics
War Risk and Stagflation Signal a 6,300 Gold Price Target
-
08
Topics
Gold Fields Urges Major Miners to Boost Gold Exploration