Gold and Silver Prices: How Supply and Demand Drive Long-Term Trends
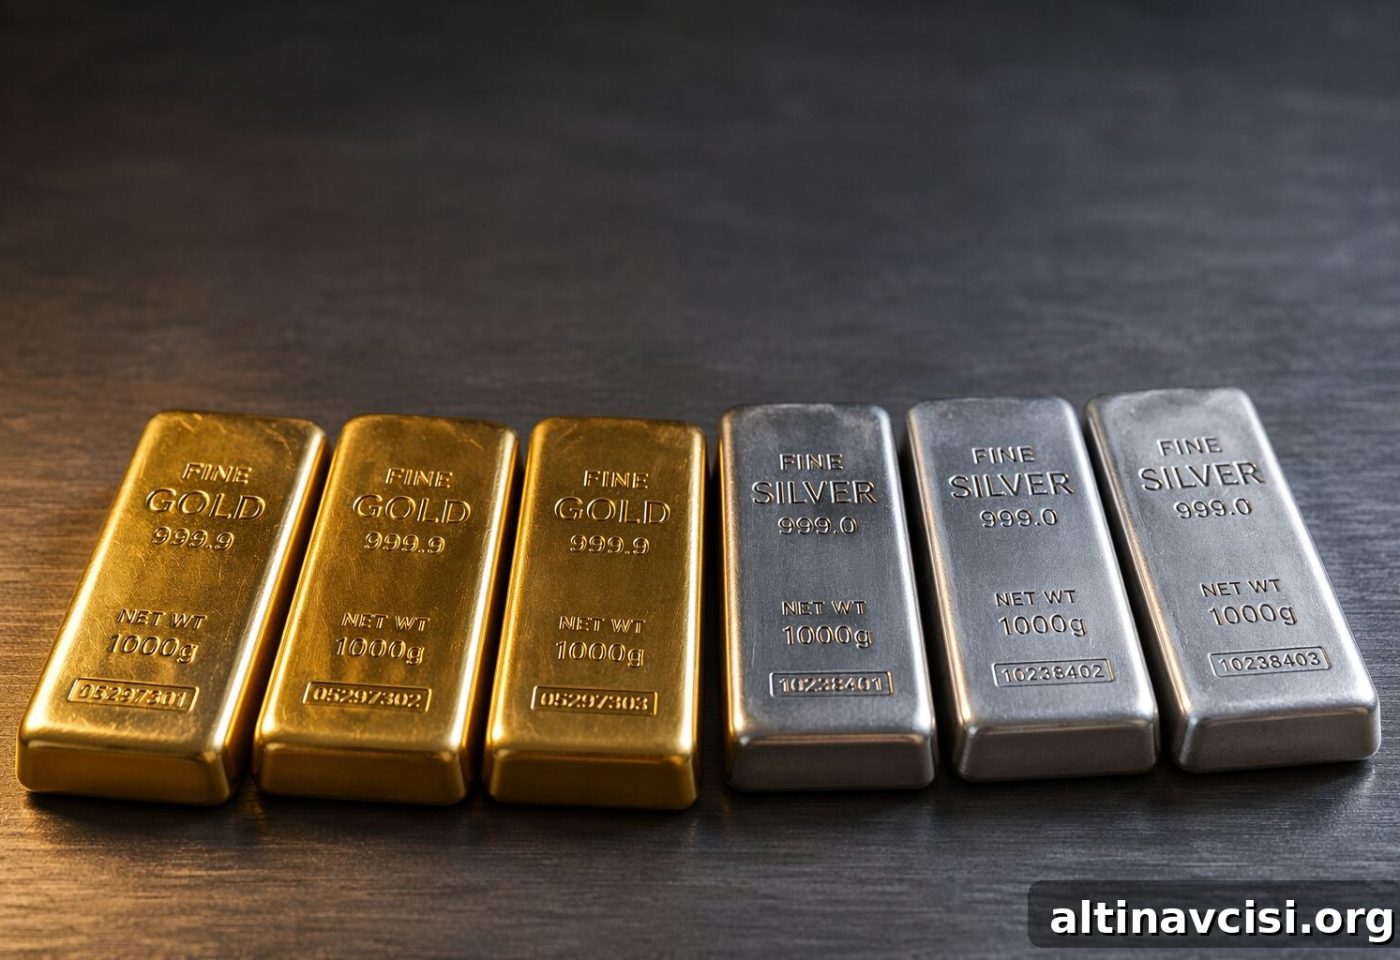
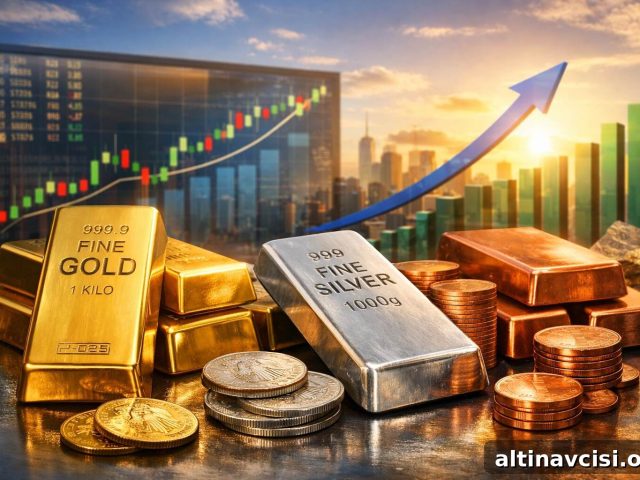
Precious metals have captured the attention of investors, policymakers, and collectors for millennia. While supply and demand remain the fundamental forces behind gold and silver prices, the real drivers are more complex: central bank actions, mining and recycling trends, industrial demand, real interest rates, and geopolitical events all interact to shape market moves. This article explains those factors and provides a practical framework for interpreting long-term price trends.
Below we outline the main supply and demand drivers for each metal, explain why silver behaves differently from gold, and highlight what these dynamics mean for investors and portfolios.
What Drives Gold & Silver Supply and Demand?
Gold Supply: Limited and Predictable
Gold supply is dominated by newly mined production and recycled metal. Global mine output has been relatively stable in recent years—total mine production reached 3,661 metric tons in 2024—because high-quality deposits are scarce and costly to develop. When the price of gold rises, miners can expand output, but meaningful increases typically take years due to long lead times for exploration and project development.
Central banks are another important source of supply. When they sell portions of their reserves, they increase market availability and tend to put downward pressure on prices. Conversely, net purchases by central banks reduce available supply and support prices. In 2024, central banks continued a multi-year buying trend, purchasing over 1,000 metric tons, a pattern concentrated among many emerging-market institutions.
Gold Demand: Investment, Jewelry, and Official Buyers
Demand for gold comes mainly from investors (including ETFs and private buyers), jewelry markets—especially in India and China—and central banks. Investment demand reacts quickly to macroeconomic signals: rising inflation, falling real rates, or periods of geopolitical stress typically boost interest in gold as a store of value. Because investor flows can be large and quick, they are often the main short-term price mover for gold.
Silver Supply: More Complex, Often a Byproduct
Silver’s supply differs from gold’s because about 70–75% of silver is produced as a byproduct of mining other metals such as copper, lead, and zinc. That structure means silver supply does not always respond directly to silver price moves: a decline in base-metal mining can reduce silver output even if silver prices rise. The remaining supply comes from primary silver mines and recycling from industrial uses and other sources.
Your Gold Buying GuideMost investors overpay when buying gold—and again when selling. This guide explains what to buy, why, and how to avoid common mistakes.
How Do Economic and Geopolitical Events Impact Prices?
Gold is widely regarded as a safe-haven asset. During recessions, banking stress, currency crises, or geopolitical conflicts, investors often shift funds into gold to preserve capital. As trust in financial systems declines, gold prices generally rise.
Real interest rates—the difference between nominal rates and inflation—are a key macro driver. When real rates are low or negative, the opportunity cost of holding non-yielding assets like gold falls, increasing its appeal. That relationship contributed to gold’s strong performance during prolonged low-rate periods in recent years.
Silver responds to many of the same macro signals but is also tied closely to industrial activity. Because a large portion of silver demand comes from industrial applications, a weak economy can reduce industrial demand and weigh on silver prices even as gold climbs. This dual sensitivity causes silver to sometimes lag gold early in a crisis, then outperform during a robust recovery.
The pandemic year 2020 illustrates this dynamic: gold rose strongly, while silver saw even bigger percentage gains as investor interest combined with a rebound in industrial optimism.
Why Is Silver More Volatile Than Gold?
Silver’s higher volatility stems from three structural factors:
1. Smaller market size. The silver market is much smaller in value than gold’s, so modest changes in demand or supply can produce large percentage moves.
2. Dual demand profile. Silver functions both as an investment asset and as an industrial commodity. Electronics, solar panels, electric vehicles, and medical devices all use silver, so industrial cycles can pull prices in the opposite direction from investment flows.
3. The gold-to-silver ratio. The gold-to-silver ratio itself can amplify volatility. Historic year-end values in recent years have ranged roughly between 70:1 and 85:1, with intra-year spikes substantially higher during market stress. Sharp moves in this ratio can create tactical trading flows that increase price swings for silver relative to gold.
The Gold-to-Silver Ratio: A Window Into Market Dynamics
The gold-to-silver ratio measures how many ounces of silver are required to buy one ounce of gold. When the ratio is historically high—meaning silver is cheap relative to gold—some investors see an opportunity to allocate to silver in anticipation of the ratio narrowing. Fluctuations in the ratio reflect investor sentiment shifts, industrial cycles, and broader economic trends, and can offer a useful tactical signal when combined with other indicators.
Silver’s Industrial Demand: A Growing Long-Term Driver
A major structural factor supporting silver is the green-energy transition. Solar photovoltaic (PV) panels, electric vehicles, and expanded electrical infrastructure all rely on silver for its superior conductivity. Industrial demand has been rising: industrial consumption in 2024 reached a record 680.5 million ounces, representing roughly 59% of total silver demand, with solar PV accounting for a significant and growing share. As decarbonization accelerates, this industrial tailwind provides a structural growth driver that gold does not share.
What Does This Mean for Your Portfolio?
Understanding supply and demand is essential for informed precious metals investing. Gold is primarily driven by monetary factors and investor sentiment, making it effective as a portfolio stabilizer and hedge against currency debasement, systemic risk, and inflation. Silver combines monetary sensitivity with industrial demand, offering greater upside potential but with increased volatility.
Over long cycles both metals frequently move in the same direction, though their paths can diverge in the short term. Identifying the current phase of the market cycle and the dominant supply-demand forces helps investors set realistic expectations and build positions that align with their risk tolerance and investment horizon.
Conclusion
Gold and silver prices are shaped by persistent structural forces—mine production, central bank behavior, macroeconomic conditions, real interest rates, and geopolitical risks. Silver adds an extra layer of complexity through its industrial applications and the accelerating green-energy transition. Investors who grasp these dynamics can better interpret price moves, manage risk, and position their portfolios for longer-term objectives. Whether you favor gold’s defensive qualities or silver’s growth potential, a supply-and-demand perspective is the clearest way to understand precious metals price behavior.
Stay On Top of Gold & Silver Prices
Receive timely market alerts and updates straight to your inbox.
People Also Ask
What are the main factors that drive gold and silver prices over time?
Gold prices are driven mainly by investor demand, central bank activity, and real interest rates, along with macroeconomic and geopolitical uncertainty. Silver is influenced by these same monetary factors plus industrial demand from electronics, solar energy, and electric vehicles. Shifts in any of these areas tend to move prices.
Why is silver more volatile than gold?
Silver’s market is smaller than gold’s, so relatively modest supply or demand changes can lead to large percentage swings. Its combined role as an industrial metal and an investment asset means it can be pulled in opposite directions by manufacturing trends and investor flows.
What is the gold-to-silver ratio and why does it matter?
The gold-to-silver ratio shows how many ounces of silver equal one ounce of gold. Year-end values in recent years have typically ranged between about 70:1 and 85:1, though intra-year spikes can be much larger during stress periods. A very high ratio may indicate that silver is undervalued relative to gold and can be used tactically by some investors.
How do industrial uses of silver affect its price compared to gold?
More than half of silver demand is industrial—used in solar panels, semiconductors, and medical devices—so silver pricing is sensitive to global manufacturing trends and the transition to green energy. Gold lacks this level of industrial demand, making its drivers largely monetary and investment-related.
Does gold protect against inflation?
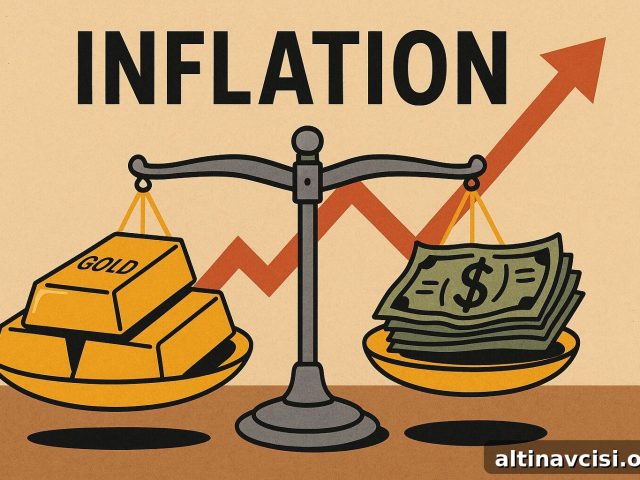
Gold has historically preserved purchasing power over long periods and often performs well when real interest rates are negative or confidence in fiat currencies weakens. While it is commonly used as an inflation hedge, performance can vary across different economic episodes.
SOURCES
1. World Gold Council — Gold Demand Trends: Full Year 2024 (report cited).
2. World Gold Council — Global Gold Demand Hits New High as Prices Soar in 2024 (press release cited).
3. The Silver Institute — Silver Supply & Demand (data cited).
4. The Silver Institute — Silver Industrial Demand Reached a Record 680.5 Moz in 2024 (report cited).
5. The Silver Institute — Silver Demand Forecast to Expand Across Key Technology Sectors (report cited).
This content is for informational purposes only and does not constitute investment advice. Past performance is not indicative of future results. Consult a qualified financial advisor before making investment decisions.
You May Also Like
- Is Gold Jewelry a Good Investment? What Most Buyers Get Wrong
- How to Spot Fake Gold and Silver: Authentication Tests and Red Flags
- Numismatic vs. Bullion Coins: Know What You’re Buying
- Silver in AI Infrastructure: The Hidden Metal Behind Every AI Model
- Gold Price Forecasts for 2026, Revisited After Q1
- Gold ETFs Are Booming. But Do You Actually Own Gold?
Popular Topics
Picked from the archive
-
01
 Topics
Why Metals Led Markets in 2025 and What It Means for 2026
-
02
Topics
Wall Street Whiplash: Stocks Rally on CPI, Plunge on PPI Shock
-
03
Topics
US Treasury Yields Rise Ahead of Major Bond Auction
-
04
Topics
Markets Slash ECB Rate-Cut Odds After Trade Deal Eases Tariff Fears
-
05
Topics
3 Questions Investors Must Ask Before Buying Any Asset in 2026
-
06
Topics
Gold vs Cash: How Inflation Destroys Dollar Purchasing Power
-
07
Topics
U.S. Gas Prices Fall to 12-Month Low Despite Heat; Storage Up 6%
-
08
Topics
Gold Price 3,767 USD: Fed Rift Deepens as China Eyes Share