Why Central Banks Bought 289 Tonnes of Gold Last Quarter
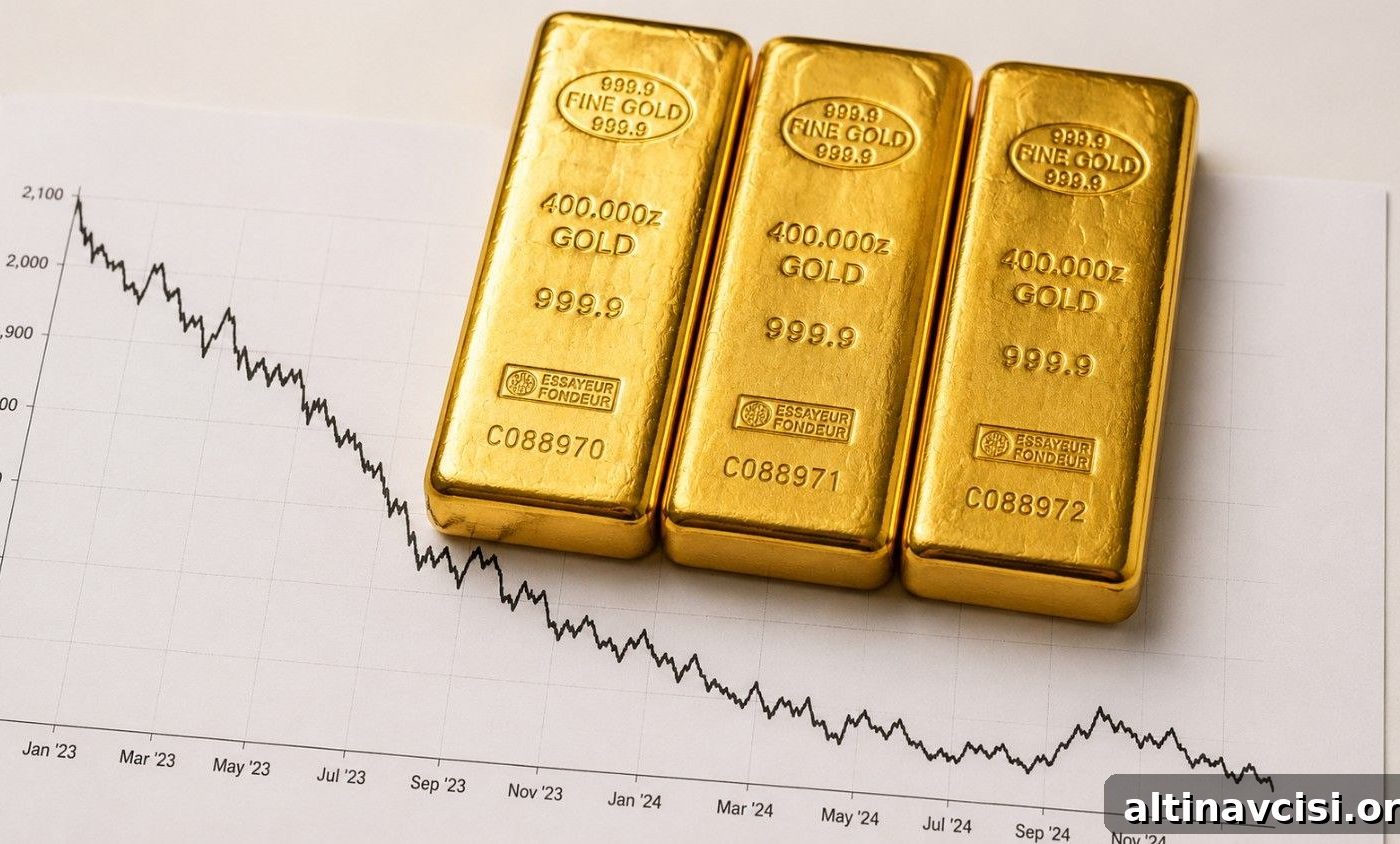
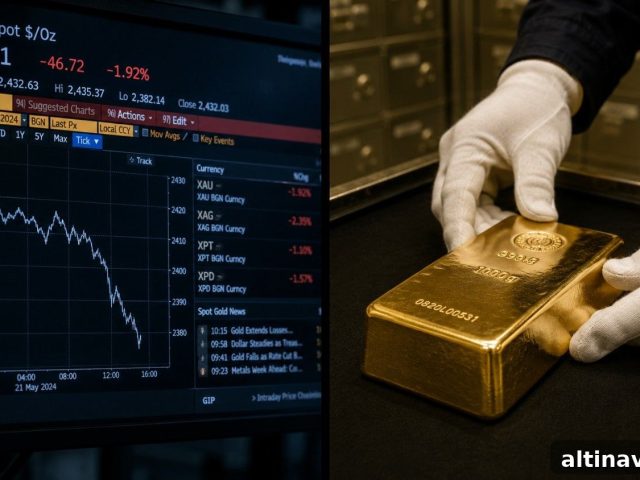
In the second quarter of 2026, global central banks made a notable and somewhat counterintuitive move: they increased gold purchases even as the metal experienced its steepest quarterly price drop in a decade. Central bank buying accelerated precisely when prices weakened, underscoring that these purchases are driven by long-term reserve strategy rather than short-term market speculation.
On July 30, the World Gold Council released its Gold Demand Trends Q2 2026 report. The standout statistic: central banks added a net 289 tonnes of gold during Q2 — a 62% increase compared with the same quarter a year earlier and the largest second-quarter total in the series. To put that figure in perspective, 289 tonnes in three months exceed the total net flows into gold ETFs across all of 2023, a year that recorded net ETF outflows of 244 tonnes.
Why Did Central Banks Buy More Gold When Prices Were Falling?
Reserve managers at central banks treat gold as a structural reserve asset, not a short-term trading instrument. Unlike hedge funds or retail traders, central banks allocate gold to meet strategic objectives that span decades. When the price of gold declines, reserve managers typically do not reverse course; instead, they often see lower prices as an opportunity to add to long-term holdings at a reduced cost.
The World Gold Council’s 2026 Central Bank Gold Reserves Survey — the largest participation in the survey’s nine-year history, with 76 reserve managers responding — reveals the reasoning behind these flows. The survey found that 89% of participating reserve managers expect global central bank gold holdings to rise over the next 12 months, and 45% plan to increase their own institution’s gold reserves. Crucially, 74% anticipate the U.S. dollar’s share of global reserves will decline over the next five years.
That expectation about the dollar is the key driver. Many central banks are systematically reducing exposure to dollar-denominated assets and reallocating into unissued, non-sovereign assets such as gold. Price movements influence timing and take advantage of dips, but they do not determine the strategic decision to diversify reserves into gold.
Country highlights from Q2: the National Bank of Poland added 51 tonnes, bringing its total reserves to 632 tonnes. The People’s Bank of China recorded a 33-tonne purchase, its largest quarterly addition since Q4 2023. Uzbekistan and Kazakhstan added 16 tonnes and 15 tonnes respectively. Russia reported selling 22 tonnes to cover fiscal needs, meaning headline net figures understate overall institutional buying interest.
What Did the Rest of the Q2 Gold Demand Picture Look Like?
Total global gold demand — including over-the-counter transactions — remained steady year-over-year at 1,269 tonnes for Q2. Demand for the first half of 2026 reached 2,522 tonnes, a 2% increase from the same period a year earlier, and the total dollar value of that demand set a record at $380 billion. That rising dollar value is notable: even as prices retreated from January’s highs, the aggregate monetary value of gold traded globally reached an all-time high.
Within the aggregate figures, demand diverged across investor types. Gold ETFs experienced 45 tonnes of net outflows as some investors sold into the pullback. In contrast, demand for physical bars and coins remained resilient at 307 tonnes, only 3% lower than the prior year; buyers in the Middle East were especially active on price weakness. Jewellery demand fell to 278 tonnes — its lowest level since the pandemic — as high prices pressured fabrication volumes. Yet spending on jewellery rose 14% in dollar terms because consumers shifted toward lighter, higher-value pieces.
An important technical revision the World Gold Council made: Q1 central bank demand was reclassified down from 244 tonnes to 57 tonnes after a portion of that demand was reallocated to over-the-counter (OTC) transactions. OTC buying surged to 327 tonnes in Q2 alone; this category includes sovereign wealth funds and government entities that do not always report publicly. Adding OTC volumes to the official central bank total highlights even stronger institutional demand than the headline alone indicates.
What Does This Mean for Your Gold Allocation?
Central banks are among the most informed, longest-duration holders of financial assets. Their actions reflect structural judgments about reserve currency risk and the role of non-printable assets. When a large majority of surveyed reserve managers expect rising central bank gold holdings and a declining dollar share in reserves, they are signaling a durable shift in reserve policy rather than a short-term market call.
Gold’s growing role in official reserves is not speculation; it is the outcome of sovereign reserve desks reacting to a monetary environment in which major reserve currencies can expand in supply. An asset that cannot be created on demand offers diversification and store-of-value properties that many reserve managers now prioritize.
Q2’s record central bank buying did not stop prices falling through the quarter — demand data tends to lag price moves — but the surge in institutional accumulation into weakness helps rebuild a structural floor under gold demand. The key question going forward is not how much 289 tonnes will move prices next week, but what happens when the largest quarterly central bank purchase on record encounters a market recovery and renewed investor interest.

The Edge Every Investor NeedsSmarter precious metals investing starts here. Subscribe for concise market insights, central bank trends, and essential updates delivered by email.
Subscription form removed in this version. Visit the site directly to sign up for market alerts and newsletters.
SOURCES
World Gold Council — Gold Demand Trends Q2 2026; World Gold Council — Gold Market Shows Resilience as Price Momentum Cools in Q2; World Gold Council — Central Bank Gold Reserves Survey 2026; GoldSilver — Gold & Silver Spot Prices
Disclaimer: This article is for informational purposes only and does not constitute financial or investment advice. Consult a qualified financial adviser before making investment decisions.
You May Also Like:
- Warsh Said the PCE Drop Was “Not Much” of a Consideration. Gold Agreed.
- Gold at $4,100. Silver Still Stuck Below $60. Five Signals Define the Next Six Weeks.
- Oil Spiked 8%. Gold Went Up Anyway. Here Is Why This Time Is Different.
- Gold Is Up $40. Here Is What the 9-3 Fed Vote Actually Means.
- Iran Fired Missiles. Oil Spiked 6%. Gold Fell. The Three-Step Chain Behind the Move.
- Everyone Is Watching the Fed. Gold Is Watching Tomorrow at 8:30 a.m.
Popular Topics
Picked from the archive
-
01
 Topics
Silver Drops 1.4% as Gold Holds; Ratio Reaches 70:1
-
02
Topics
BEA Removed Silver From GDP: What It Means
-
03
Topics
Gold and Silver Prices Jump Amid Strait of Hormuz Tensions
-
04
Topics
Gold Price Falls Before US Market Opens
-
05
Topics
Which Countries Hold the Most Gold Reserves?
-
06
Topics
Gold Price Falls Today: Why $4,500 Holds as Support
-
07
Topics
Markets Eye Friday CPI as Credit Card Debt Reaches Record High
-
08
Topics
Gold Drops as China Buys Most in 17 Months