Gold Price Falls Today: Why $4,500 Holds as Support

Why is gold falling today?
On May 26, 2026, gold is trading near $4,500.32, down roughly 0.23% for the session, while silver is moving in the opposite direction, up about 0.73 to $76.15. Short-term drivers — stalled U.S.–Iran talks, a more hawkish Federal Reserve stance, and a firmer U.S. dollar — explain today’s dip. Those factors are familiar to markets, but they do not fully explain why the $4,500 level has repeatedly acted as a reliable support for gold.
Why does $4,500 matter more than today’s drop?
Gold reached an all-time high of $5,589 on January 28, 2026 and has since retraced about 19% from that peak. Even so, the $4,500 area has repeatedly held as support during the pullback. Multiple tests of the same level without a decisive breakdown suggest a structural reason for buyers to defend that price, not merely short-term trading noise.
That structural support comes from persistent economic pressures. On May 22, the University of Michigan published its final May consumer sentiment reading at 44.8 — the lowest level in the survey’s 74-year history and below the previous record low. A majority of respondents reported that high prices are eroding their finances, with one-year inflation expectations rising to 4.8% and longer-run expectations moving higher to 3.9%. Those shifts indicate that consumers anticipate inflation will remain elevated rather than being a short-lived spike.
The Bureau of Economic Analysis confirmed that first-quarter 2026 PCE inflation — the Federal Reserve’s preferred inflation gauge — came in at about a 4.5% annualized rate, roughly double the Fed’s 2% objective. Falling consumer confidence and embedded inflation expectations do not vanish because the market has a down day. These economic realities underpin demand for gold as a store of value and explain why buyers remain willing to step in around $4,500.
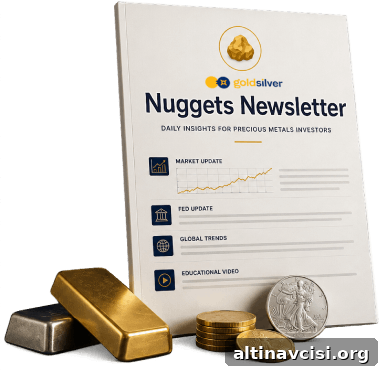
The Edge Every Investor Needs
Smarter precious metals investing starts here. The Nuggets Newsletter brings you essential market insights, Fed updates, global trends, educational videos, and much more.
What’s driving the drop — and why it’s not a structural shift?
Three factors pushed gold lower in the latest session, but none fundamentally alter the long-term case supporting the metal.
Iran: The U.S. naval blockade of Iranian ports has been in place since April 13. Officials reported progress in peace discussions, but formal agreement and certification remain pending. Until both sides sign and certify a deal, the blockade and its implications for energy markets persist, keeping oil prices elevated and feeding inflation expectations.
The Fed: Federal Reserve commentary turned noticeably less dovish on May 22 when Governor Christopher Waller recommended removing the easing bias from policy language, opening the door to a potential rate increase. Market-implied odds for a 25-basis-point hike by December 2026 have risen, reversing expectations from a year ago when the market anticipated rate cuts.
The dollar: When markets price in higher interest rates, the dollar typically strengthens. A firmer dollar makes dollar-denominated commodities such as gold more expensive for buyers holding other currencies, which can reduce demand and place downward pressure on the price. This is the mechanical link that often translates Fed signals into near-term moves in gold.
All three forces are meaningful in the short run. Still, they do not resolve the deeper tension between weak consumer confidence and persistent inflation — the larger structural dynamic that has supported buying interest near $4,500.
What dilemma keeps the $4,500 floor intact?
The Federal Reserve faces a difficult choice: tighten policy to bring down inflation into an economy where consumer sentiment has hit record lows, or refrain from further tightening while inflation runs significantly above target. Neither option offers a clean path. Tightening risks aggravating already weak confidence and growth, while standing pat leaves inflationary pressures unchecked.
That structural dilemma supports gold as a hedge: investors and institutions view the metal as protection against prolonged inflation, currency depreciation, and fiscal strains. Even when some institutions trim near-term price targets — UBS lowered its year-end 2026 gold forecast by $400 to $5,500 — those revised targets remain materially above current spot levels, indicating that many professional forecasts still price in higher gold over the medium term.
What should gold watchers look for Thursday, May 28?
Two key U.S. releases arrive at 8:30 a.m. ET and could influence short-term sentiment. The Bureau of Economic Analysis will publish its second estimate for Q1 2026 GDP. If growth is revised lower while PCE inflation remains elevated, the argument for stagflation — weak growth paired with persistent inflation — gains traction. That scenario is typically constructive for gold.
The same morning also brings April PCE data, the Fed’s freshest inflation reading. A hotter-than-expected PCE print would increase the odds of future rate hikes and likely pressure gold in the near term. A cooler reading would reduce that headwind and give gold more room to recover. Either outcome should be seen in the context of the broader structural picture: household purchasing power under strain, continued central bank accumulation of physical gold, and fiscal trends that increase the risk of longer-term currency erosion.
In short, daily volatility matters for traders, but the math that keeps buyers active near $4,500 is rooted in durable economic forces. For now, that price level continues to act as a meaningful floor because underlying conditions have not changed.
Stay On Top of Gold & Silver Prices
Get important market alerts sent straight to your inbox.
SOURCES
1. nFusion Solutions — Gold and Silver Spot Prices, May 26, 2026
2. CBS News — Highest Gold Price in History: How It’s Changed from 2025 to 2026
3. University of Michigan News — Consumer Confidence Falls as Gas Prices, Inflation Worries Climb
4. University of Michigan Institute for Social Research — Surveys of Consumers, May 2026
5. U.S. Bureau of Economic Analysis — GDP Advance Estimate, 1st Quarter 2026
6. Federal Reserve Board — Governor Waller: Lecture on the Economic Outlook, May 22, 2026
7. CNBC — Traders Now See Next Fed Interest Rate Move as a Hike Following Inflation Surge
8. CBS News — Iran war live updates and naval blockade reporting
9. CBS News — Statements on Iran talks progress
10. Reuters — UBS Lowers Year-End 2026 Gold Price Forecast to $5,500/oz
11. U.S. Bureau of Economic Analysis — GDP Second Estimate, 1st Quarter 2026 (due May 28, 2026)
12. U.S. Bureau of Economic Analysis — Personal Consumption Expenditures Price Index (April 2026, due May 28, 2026)
Disclaimer: This article is for informational purposes only and does not constitute financial or investment advice. Always consult a qualified financial adviser before making investment decisions.
You May Also Like:
- Gold Is Down Today. Here’s Why Smart Money Is Still Buying.
- Silver Up 3%. Gold Up 1.3%. The Ratio Tells You Everything.
- Iran News Sent Gold Price Both Ways. The Driver Was Never Iran.
- Gold Falls 0.5% on Iran Deal: The Floor Holds
- Is Gold Being Repriced? 5 Major Institutions Say Yes.
- Silver Dropped 12%. Gold Dropped 3%. That Gap Is the Story.
- Gold Price Holds Firm After Hawkish Fed Minutes — Here’s Why
- Why London Still Sets the Gold Price — and Asia Doesn’t
Popular Topics
Picked from the archive
-
01
 Topics
5 Factors Driving Gold and Silver Prices Higher
-
02
Topics
US Treasury Yields Rise Ahead of Major Bond Auction
-
03
Topics
Gold Price Volatility Back to COVID-Era Levels
-
04
Topics
Gold Price Nears $3,700 Ahead of Fed Meeting
-
05
Topics
CPI 3.3% and GDP Stalling: Is 2026 Stagflation Coming?
-
06
Topics
Dollar Drops as Markets Price In Fed Cuts; Tariff Fears Rise
-
07
Topics
Why Turkey Sold Its Gold and What It Means for Sound Money
-
08
Topics
Gold Price Forecast: Oil Futures Diverge From Stocks