Silver Up 3% vs Gold 1.3%: What the Gold-Silver Ratio Means
Key Takeaways:
- On May 25, 2026 silver rose 2.99% — roughly 2.3 times gold’s 1.31% gain — as optimism about a U.S.–Iran memorandum of understanding eased energy concerns and lifted expectations for industrial demand.
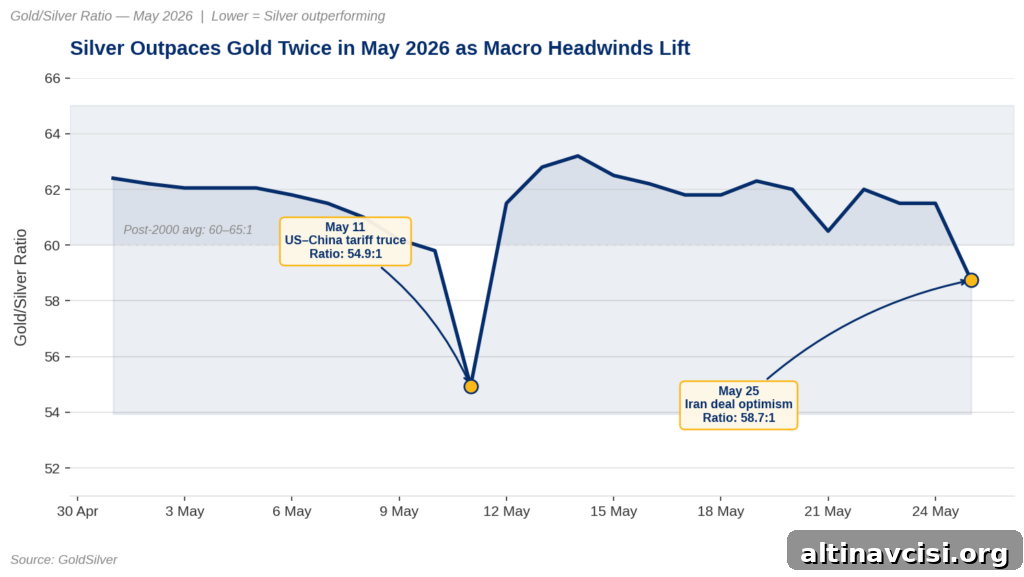
- The gold/silver ratio compressed to 58.7:1, below the modern post-2000 average of 60–65:1. Similar rapid ratio compression occurred on May 11 after a U.S.–China tariff truce, illustrating that when macro headwinds ease, silver often outpaces gold.
- Watch May 28: the Bureau of Economic Analysis will publish the Q1 2026 GDP second estimate. A downward revision and sustained movement toward a 55:1 ratio are two key signals to monitor ahead of the June 16–17 Federal Open Market Committee meeting.
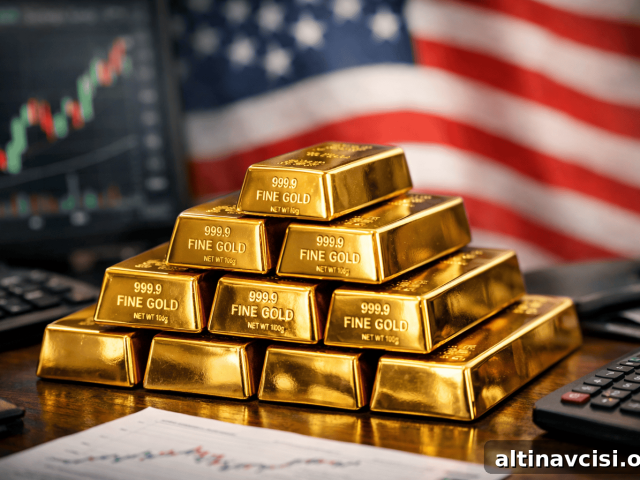
On May 25, 2026 both precious metals moved higher, but silver’s advance was noticeably larger. Silver climbed 2.99% to $77.78 per ounce, while gold rose 1.31% to $4,568.54. The gold/silver ratio tightened to 58.7:1 — a meaningful compression beneath the typical post-2000 range of 60–65:1 — marking one of the most pronounced three-week shifts since the market rebound following the 2020 pandemic. With U.S. equity and bond markets closed for Memorial Day, London trading led the price action.
What drove the move?
The immediate catalyst was weekend reporting that the U.S. and Iran had largely agreed on a memorandum of understanding to reopen passage through the Strait of Hormuz. While President Trump indicated a blockade would remain until a formal agreement is signed — leaving timing and certainty unresolved — markets responded to the prospect of reduced regional disruption.
When the risk of supply disruption eases, oil prices usually soften. Lower energy costs take pressure off inflation expectations, which can weaken the dollar — the U.S. Dollar Index (DXY) fell 0.28% to 98.96 on May 25 — and a softer dollar typically supports precious metals. That chain explains gold’s rise. It only partly explains why silver rallied much more strongly.
Silver’s larger move reflects its dual role: it is both a monetary metal like gold and, importantly, an industrial metal. On macro developments that reduce cost or raise growth expectations, silver often receives a second, demand-driven bid that gold does not.
The Edge Every Investor Needs
Smarter precious metals investing starts with concise, timely market insight: price moves, Fed updates, global trends, and practical education to help you make better decisions.
Sign up to receive short, focused updates on gold and silver markets delivered to your inbox.
Why does silver outperform gold on peace catalysts?
The key is silver’s industrial demand. Industry accounts for a large share of total silver consumption — from solar panels and electric vehicles to electronics and data center components. When energy costs decline, manufacturers can operate with better margins and often ramp activity, which lifts industrial metal demand. Gold primarily reacts as a store of value; silver benefits from both monetary demand and industrial demand. That dual demand profile explains why silver frequently accelerates faster than gold when macro headwinds ease.
This dynamic also explains the market’s behavior during other recent events. For example, at the beginning of May the gold/silver ratio fell sharply after a U.S.–China tariff truce repriced industrial demand; it widened again when mid-May inflation data surprised to the upside. Each time a macro headwind cleared, silver caught up faster.
What is the gold/silver ratio saying right now?
The ratio moved more quickly in May 2026 than during any similar three-week stretch since the 2020 recovery. It began May near 62:1, dropped to about 54.9:1 following the tariff truce on May 11, then climbed back into the low 60s when inflation data proved sticky, and settled at 58.7:1 on May 25. Institutional analyst targets differ: J.P. Morgan’s full-year silver average sits near $81 per ounce, while Citigroup’s second-half target was cited around $110. These estimates reflect divergent views on how much industrial demand and broader macro conditions will support silver through the remainder of the year.
A falling ratio in a rising-price environment signals two positive conditions at once: protection of purchasing power alongside strengthening industrial activity. That combination is uncommon, and when both are present, silver typically benefits more than gold.
What most coverage is missing
This recent compression did not begin on May 25. It started on May 11 with the tariff truce, reversed when inflation data hit, and resumed on Iran deal optimism. Three separate improvements in the macro backdrop produced three episodes where silver caught up faster than gold. That pattern is structural, not coincidental.
On the supply side, industry surveys and market reports have documented multi-year silver supply deficits, with hundreds of millions of ounces drawn from global inventories since 2021. Much of silver production is a byproduct of mining for other metals, which limits how quickly supply can expand in response to rising demand. When industrial and investment demand reprice upward, the physical market tightens more quickly than supply can respond, amplifying silver’s price reaction.
What to watch next
The next major data point is the Bureau of Economic Analysis’s Q1 2026 GDP second estimate, released Wednesday, May 28. The advance estimate showed 2.0% growth, below the 2.3% Wall Street consensus. A downward revision paired with ongoing inflation would increase the odds of stagflation — an environment in which both precious metals often perform well, long-term rates come under pressure, and the dollar weakens.
Also keep an eye on the gold/silver ratio near 55:1. That level acted as a short-lived floor on May 11; a sustained break below it would likely signal another leg of silver outperformance as industrial and investment bids converge.
Stay On Top of Gold & Silver Prices
Receive important market alerts sent straight to your inbox.
Sign up for concise updates and alerts on market-moving developments in precious metals.
SOURCES
1. Silver Institute — World Silver Survey: Silver Supply & Demand
2. Silver Institute — Silver Industrial Demand Reached a Record in 2024
3. GoldSilver — Silver Price Outlook May 2026: Stop Chasing the Number
4. GoldSilver — Coverage on institutional silver price targets and market commentary
5. Bureau of Economic Analysis — GDP Advance Estimate, 1st Quarter 2026
6. Federal Reserve — FOMC calendars and policy information
Disclaimer: This article is for informational purposes only and does not constitute financial or investment advice. Always consult a qualified financial adviser before making investment decisions.
You May Also Like:
- Iran News Sent Gold Price Both Ways. The Driver Was Never Iran.
- Gold Falls 0.5% on Iran Deal: The Floor Holds
- Is Gold Being Repriced? Five Major Institutions Say Yes.
- Silver Dropped 12%. Gold Dropped 3%. That Gap Is the Story.
- Gold Price Holds Firm After Hawkish Fed Minutes — Here’s Why
- Why London Still Sets the Gold Price — and Asia Doesn’t
- Gold Price at ~$4,502: Is the Dip a Buy? BofA Says $6,000
- Gold Didn’t Fall on Iran Peace News. That’s the Point.
Popular Topics
Picked from the archive
-
01
 Topics
Gold Prices Near Record as Tariffs Return
-
02
Topics
Inflation Under Trump: Fact Check on Price Changes
-
03
Topics
How Gold Is Changing Wall Street’s 60/40 Portfolio
-
04
Topics
Tech Giants Drive 90% of Earnings Growth Despite Trade War Fears
-
05
Topics
Gold and Silver Rally Amid Market Volatility
-
06
Topics
Why Gold Prices Held Steady After Iran Peace News
-
07
Topics
Gold Price Volatility Back to COVID-Era Levels
-
08
Topics
Wholesale Prices Jump Most in 3 Years as Tariffs Hurt US Economy