
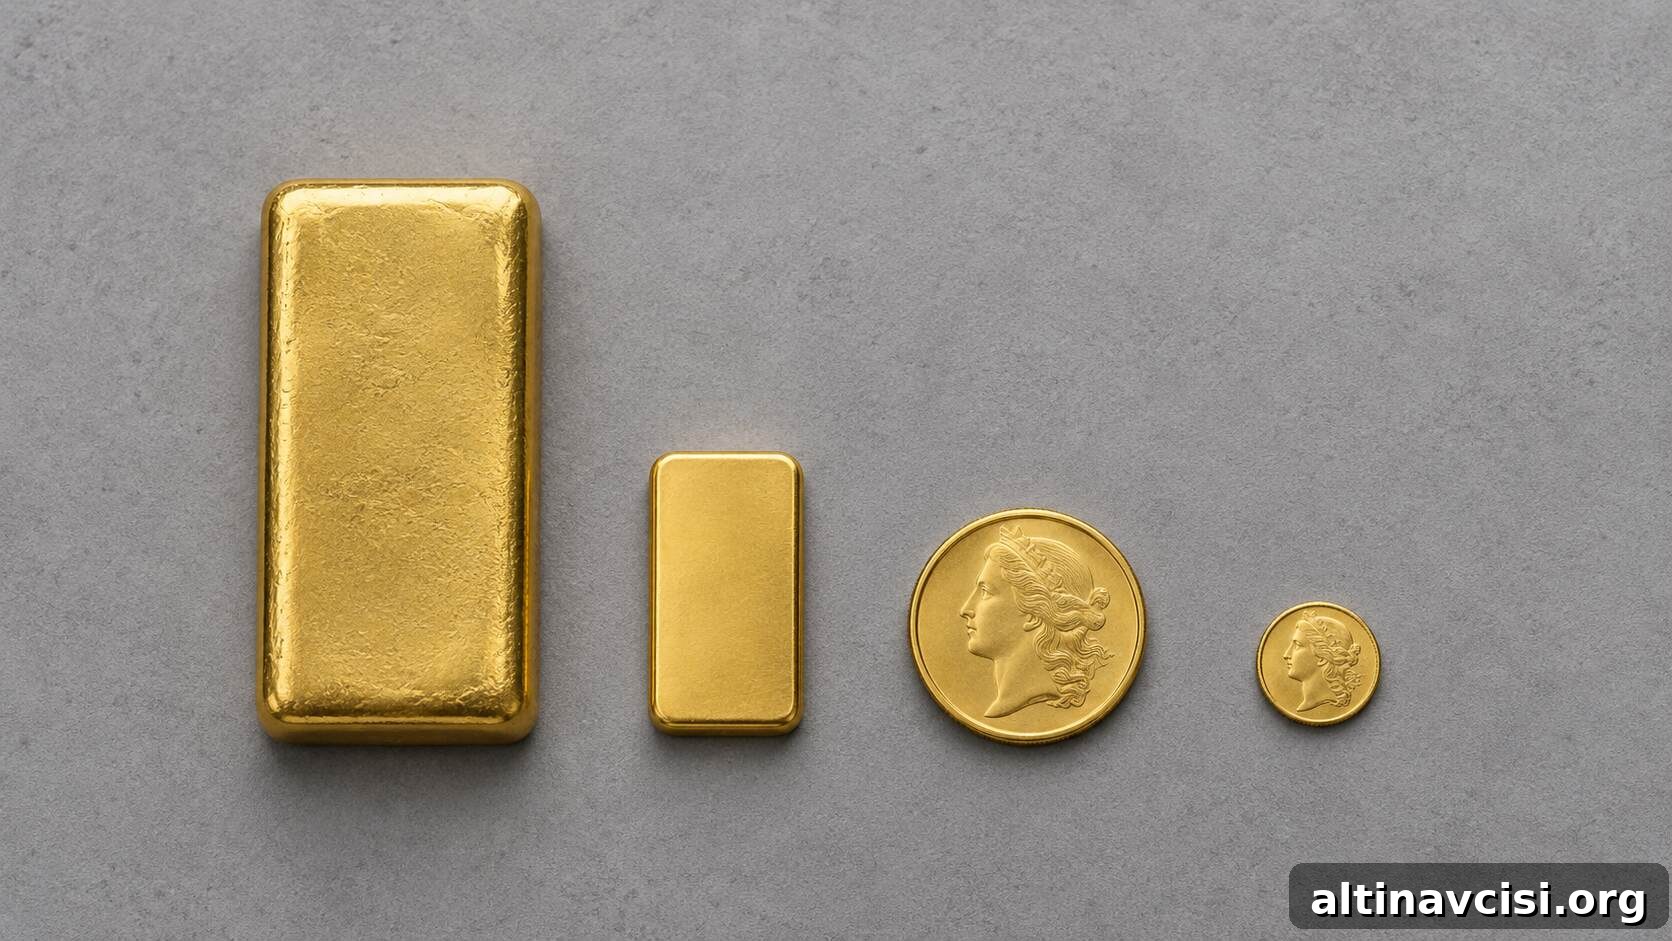
The least expensive way to buy physical gold is the format that delivers the most metal per dollar spent. That depends on the premium charged above the spot price, not the headline gold quote itself.
Direct answer: Larger formats are the most cost-effective. On September 21, 2026, GoldSilver surveyed 110 in-stock gold listings across major U.S. online bullion dealers. The median premiums that day were: 10 oz bars 1.96%, 1 oz bars 2.99%, 1 oz sovereign coins 3.89%, and 1/10 oz coins 20.66%. As a result, a buyer who purchases tenth-ounce coins receives roughly 15.5% less gold for the same outlay compared with buying 10 oz bars.
Key takeaways:
- Fractional sizes carry the largest controllable cost in retail gold. A 1/10 oz coin’s median premium of 20.66% represents a much larger markup over spot than the roughly 2% charged for larger bars.
- Buying fractional coins reduces the metal you acquire. With the observed premiums, a tenth-ounce purchaser receives about 15.5% less gold for the same money as someone buying 10 oz bars.
- On a $10,000 purchase at the reference spot used in the survey, the difference is material. At the sample spot of $4,346.51 per ounce, the shortfall equates to roughly $1,520 worth of gold.
- Sovereign (government-struck) 1 oz coins were unusually inexpensive in the September 21 sample. The median sovereign premium registered 3.89%, which is below the typical 4%–8% band.
- Not all sovereign coins cost the same. The South African Krugerrand showed a 2.49% median premium, below the 2.99% median for generic 1 oz bars in that sample.
What is a gold premium and why does it determine your cost?
The spot price is a wholesale benchmark for one troy ounce of gold. Dealers rarely, if ever, sell physical pieces at spot. Each coin or bar carries a premium above spot to cover refining, minting, packaging, assay, distribution, insurance and dealer margin.
Most of those expenses are fixed per individual unit rather than per ounce. Producing, packaging and handling a 1/10 oz coin requires nearly the same work and logistics as a 1 oz coin, yet contains one tenth the metal. The fixed cost therefore spreads over much less gold, causing the premium percentage to rise sharply for smaller formats.
Because you cannot control the spot price, your choice of format is the primary way to control how much metal you receive for each dollar spent.
The Knowledge That Changes Everything

Two essential guides — yours free. Learn why gold matters and why fiat currencies repeatedly fail in the long run.
How much does each gold format cost over spot?
GoldSilver monitored retail listings for matched gold products at major U.S. online bullion dealers and recorded every in-stock observation on September 21, 2026. The results below use the median premium from that sample and exclude pricing outliers. The reference spot price in the dataset was $4,346.51 and remained consistent across the sample, so formats are comparable.
Premium over spot by gold product format, September 21, 2026. Median of 110 in-stock listings at major U.S. online bullion dealers. Market-wide observations.
| Format | Median premium | Observed range | Observations |
|---|---|---|---|
| 10 oz bar | 1.96% | 1.73% to 3.54% | 6 |
| 1 kg bar | 2.54% | 1.96% to 3.19% | 4 |
| 1 oz bar | 2.99% | 1.05% to 3.67% | 8 |
| 1 oz sovereign coin | 3.89% | 0.81% to 7.68% | 52 |
| 1/2 oz coin | 8.56% | 6.54% to 18.51% | 12 |
| 1/4 oz coin | 12.32% | 5.32% to 15.50% | 16 |
| 1/10 oz coin | 20.66% | 15.67% to 20.92% | 12 |
The premium curve is steep mainly at the small end: moving from a 1/10 oz coin to a 1 oz coin reduces the premium by nearly 17 percentage points. By comparison, upgrading from a 1 oz bar to a 10 oz bar saves about one percentage point. The 10 oz and 1 kg figures are based on relatively few observations, and their ranges overlap; both sit near 2% in this sample.
What does the premium cost you in ounces?
Percentages can understate the real effect. Below is the same data expressed as ounces acquired for a $10,000 purchase at the sample spot price of $4,346.51, using the median premiums recorded that day.
| Format | Ounces acquired | Metal given up vs 10 oz bar | Share of metal received |
|---|---|---|---|
| 10 oz bar (baseline) | 2.2565 oz | 0.000 oz | 100.0% |
| 1 kg bar | 2.2437 oz | 0.013 oz | 99.4% |
| 1 oz bar | 2.2339 oz | 0.023 oz | 99.0% |
| 1 oz sovereign coin | 2.2146 oz | 0.042 oz | 98.1% |
| 1/2 oz coin | 2.1193 oz | 0.137 oz | 93.9% |
| 1/4 oz coin | 2.0483 oz | 0.208 oz | 90.8% |
| 1/10 oz coin | 1.9068 oz | 0.350 oz | 84.5% |
Put simply: a $10,000 purchase of tenth-ounce coins produced about 0.350 oz less gold than the equivalent purchase of 10 oz bars on the same day. At the referenced spot price that is about a $1,520 shortfall.
Because the final column in the table is a ratio of premiums, it does not depend on the gold price itself. The roughly 15.5% shortfall for tenth-ounce coins holds whether gold trades at $2,000 or $5,000 per ounce.
Why were sovereign coins cheaper than usual in this sample?
Sovereign 1 oz coins typically trade at 4%–8% premiums because they offer global recognition and easier resale. In the September 21 sample, however, the median sovereign premium was 3.89% across 52 observations, which sits below the customary range and is the most robust part of the dataset.
A generic 1 oz bar had a 2.99% median premium that day, so the premium gap between branded sovereign coins and plain bars was only 0.90 percentage points. On a $10,000 purchase, that gap equals roughly $84 of forgone metal—small enough to make sovereign coins a compelling option when liquidity and easy resale matter.
Which sovereign coin carried the lowest premium?
The median value conceals significant variation across sovereign issues. In the sample, seven common 1 oz sovereign coins displayed a spread of 393 basis points in median premiums. The South African Krugerrand had the lowest median at 2.49%, undercutting the 2.99% median for generic 1 oz bars. Conversely, the American Gold Buffalo recorded a 6.42% median premium.
| 1 oz sovereign coin | Median premium | Observations |
|---|---|---|
| South African Krugerrand | 2.49% | 8 |
| Austrian Philharmonic | 3.34% | 8 |
| Canadian Maple Leaf | 3.81% | 8 |
| Australian Kangaroo | 3.82% | 6 |
| Gold Britannia | 3.95% | 6 |
| American Gold Eagle | 4.52% | 8 |
| American Gold Buffalo | 6.42% | 8 |
Because premiums vary more between sovereigns than between bars and coins in this sample, the practical question for buyers is not simply “coins or bars?” but “which coin or which bar?” Check the premium before making a choice based on design or brand alone.
Does this mean fractional gold is a mistake?
Not necessarily. Fractional coins offer benefits that larger bars cannot: they are divisible, easier to gift, and simpler to move in small quantities. They can serve estate planning and liquidity needs that a 10 oz bar cannot. Paying a higher premium for those practical advantages can be reasonable when the buyer understands the tradeoff.
The issue arises when buyers choose fractional pieces because the sticker price looks affordable, without recognizing the higher premium. In that case they effectively acquire less metal for their money. If your goal is to maximize ounces for a long-term core holding, larger formats are more efficient, but they bring storage and divisibility considerations that must be weighed.
Why do premiums matter more when gold is expensive?
When the spot price is high, the absolute dollar cost of a given percentage premium grows. A 20.66% premium on lower gold prices cost far less in dollars per ounce than the same percentage at higher spot. The premium is not a fee that evaporates; it raises your breakeven point. Metal bought at a large premium requires a proportionally larger rise in spot before you can resell at no loss.
In short: the higher the spot price, the more any percentage premium costs you in concrete dollars, and the larger the penalty for choosing an inefficient format.
How should you use these numbers?
Decide what role the purchase will play before selecting a format. For a long-term core holding where maximizing ounces matters, choose the largest format you can comfortably store and later sell. If you need divisibility, gifting options or faster resale, 1 oz sovereign coins remain a sensible compromise—and in the September 21 sample the cheapest sovereign actually undercut the generic bar.
Always compare quoted premiums to benchmarks like the tables above rather than to the headline gold price alone. Premiums change with mint production, dealer inventory and retail demand, so treat any reading as a snapshot. Check the premium of a specific product by dividing its retail price by the current spot price to see how it compares to the medians shown here.
Stay On Top of Gold & Silver Prices
Get important market alerts sent straight to your inbox.
SOURCES
1. GoldSilver – Retail premium survey, 110 in-stock gold listings across major U.S. online bullion dealers (September 21, 2026).
2. GoldSilver – Live gold price chart (reference spot used in this article: $4,346.51, September 21, 2026).
3. Federal Reserve Economic Data – 10-year real and nominal yields (observed mid-September 2026).
Disclaimer: This article is for informational purposes only and does not constitute investment advice. Past performance is not indicative of future results. Consult a qualified financial advisor before making investment decisions.
You may also like:
- How Much Silver Should You Own? A portfolio allocation guide
- Who Owns U.S. Debt? Central bank holdings and distribution
- What Is Junk Silver? Why certain old dimes and quarters command high premiums
- Why Is Silver Demand Linked to AI and data centers?
- Supply dynamics: when silver is a byproduct of copper mining
- Inherited Gold IRA: beneficiary rules and tax considerations
- The Cantillon Effect: how money printing redistributes wealth