Key Takeaways
- Purchasing power is how much real goods and services a unit of currency can buy. If the money supply grows faster than the economy, purchasing power declines even if your nominal bank balance does not change.
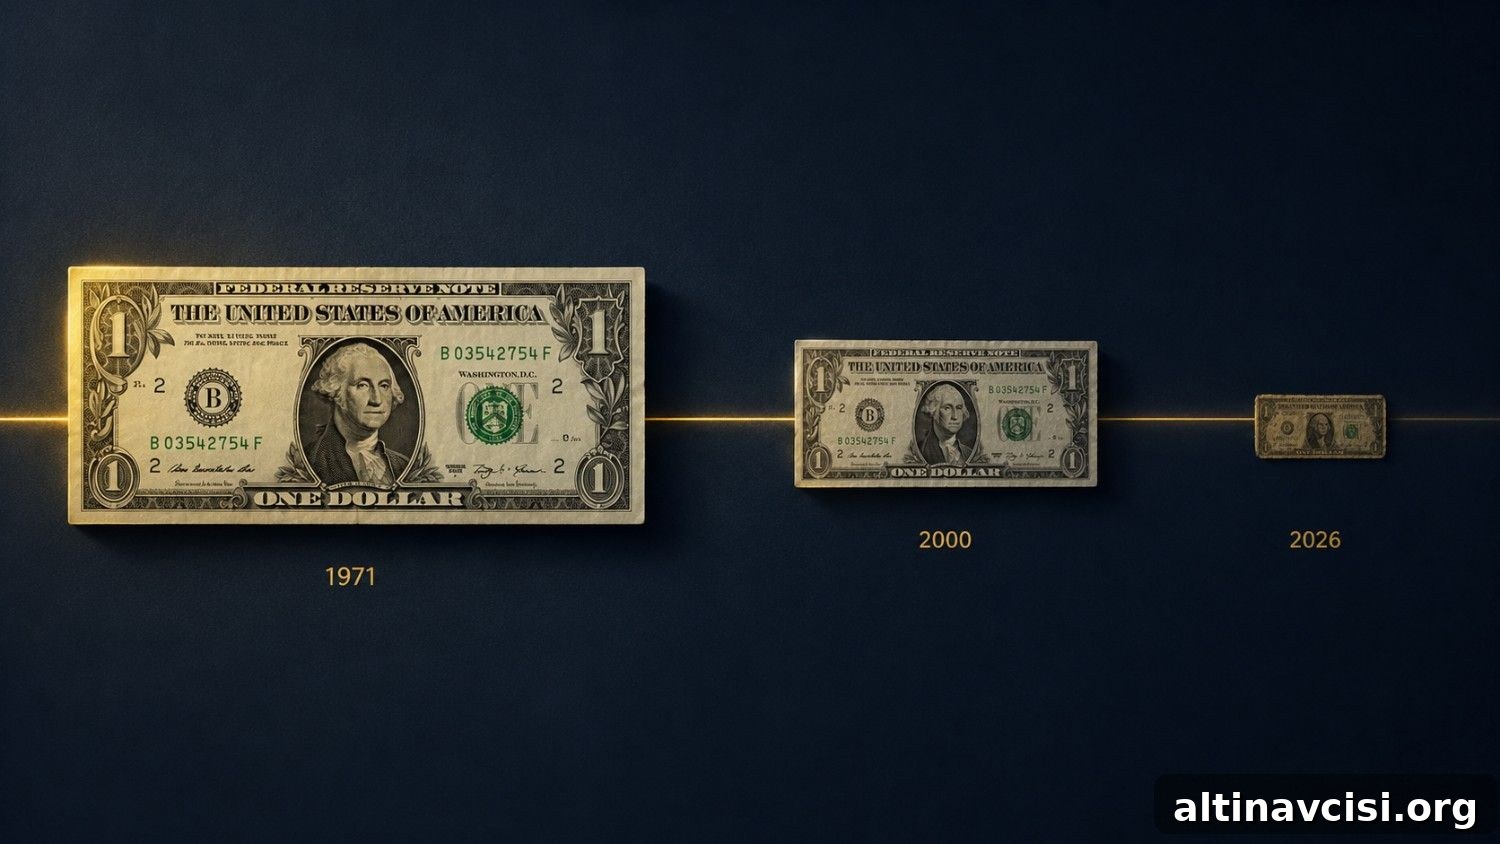
- Since August 15, 1971, the U.S. dollar has lost roughly 87% of its purchasing power, based on CPI-U measures. What cost $1 in 1971 now costs about $8.
- Gold’s supply increases by less than 1% per year on average from mining, which gives it a structural scarcity. That scarcity helps an ounce of gold buy a comparable basket of goods across very different monetary eras.
- The Cantillon Effect means inflation is uneven. Those closest to newly created money—financial institutions, large asset holders and government contractors—use it before prices adjust; ordinary savers are last and suffer the loss of purchasing power.
- Gold exists outside the fiat system. Governments cannot create it by decree, central banks cannot expand its supply at will, and no printing press can dilute it. That distinguishes gold from every fiat currency in history.
Purchasing power is the amount of real goods and services a unit of currency can buy at a given time — a vital metric that bank statements do not show.
When more money chases the same quantity of goods, each dollar buys less. The U.S. Bureau of Labor Statistics measures this through the Consumer Price Index (CPI). Since 1971, the dollar’s purchasing power has declined sharply by CPI measures. By contrast, gold has preserved purchasing power over centuries because its supply is physically constrained and cannot be increased by policy.
Official inflation readings can look modest in a single year. For example, headline CPI readings in recent years have varied, but even a 2% annual inflation rate erodes purchasing power significantly over time. A fixed dollar amount loses about 18% of its purchasing power over a decade at a 2% annual rate; over thirty years the loss is far larger. Savers who understand this plan accordingly rather than panic.
For most of history, money and purchasing power were tightly linked because coins contained metal value. That changed on August 15, 1971, when the U.S. dollar’s last formal link to gold ended. Since then, purchasing power has become a moving target that tends to decline for those holding cash.
What Does Purchasing Power Actually Measure?
Purchasing power measures the real-world command that a unit of money has over goods and services. It answers: how much can this dollar buy today compared with yesterday, last year, or a generation ago?
The Bureau of Labor Statistics tracks changes using the Consumer Price Index, which follows the price of a typical basket of items including food, housing, transportation, medical care and education. When the CPI rises, each dollar buys a smaller share of that basket — meaning purchasing power has fallen.
The Federal Reserve prefers the Personal Consumption Expenditures Price Index (PCE), which often runs slightly lower than CPI. The long-term cumulative decline in purchasing power matters more than any single-year reading. Small annual losses compound into major reductions in real wealth over decades.
The Knowledge That Changes Everything
Two essential guides — free. Learn why gold matters and why fiat currencies tend to lose purchasing power over time.
What Has Happened to the Dollar’s Purchasing Power Since 1971?
The decisive moment was August 15, 1971, when the U.S. ended dollar convertibility into gold and effectively closed the Bretton Woods system. Before that, foreign central banks could exchange dollars for gold, which limited how fast the U.S. could expand money supply. Removing that constraint allowed sustained monetary expansion over decades.
According to CPI-U measures, the dollar has lost around 87% of its purchasing power since 1971. This decline was gradual rather than sudden, the result of repeated increases in money supply rather than one dramatic collapse. The 2020–2022 period was a recent acute episode: M2 rose significantly in a short span, and consumer prices followed with a notable increase.
Why Does Fiat Currency Lose Purchasing Power Over Time?
Fiat money lacks a physical constraint on supply. Governments that need to finance spending can have central banks create new money through bond purchases, lending programs or reserve expansion. When new money enters the economy, it increases demand relative to supply and pushes up prices, reducing the real value of existing currency units.
If money in circulation doubles while goods remain similar in quantity, each unit becomes worth roughly half as much in real terms. Savers holding the old money experience a loss in purchasing power. This pattern has repeated across many societies and eras, from ancient debasements to modern quantitative easing programs.
Who Bears the Cost When Purchasing Power Falls?
Inflation is not felt equally. The Cantillon Effect explains that newly created money benefits those who receive it first — banks, large asset holders and government contractors — because they spend it before prices adjust. Ordinary workers and savers see higher prices only after the money has circulated, effectively transferring purchasing power toward early recipients.
This unequal timing underscores why purchasing power erosion matters for personal finance: savers must consider how to protect the real value of accumulated wealth when the unit of account is prone to decline.
How Does Gold Preserve Purchasing Power?
Gold’s scarcity is the core reason it preserves purchasing power. Global mine production grows slowly—historically under 1% per year on average—so no central bank or government can rapidly expand the supply. That physical constraint gives gold a durable purchasing power function across long time horizons.
Historical comparisons support this. Studies comparing ancient gold-denominated wages to modern equivalents show that expressing pay in ounces of gold produces surprisingly comparable results across millennia. While nominal currency values and purchasing power in currencies have shifted dramatically, gold-denominated measures have remained within a recognizable range.
Does Gold Hold Its Value Against Commodities Too?
Yes. The gold-to-oil ratio demonstrates long-run stability: over decades, an ounce of gold has typically bought a similar number of barrels of oil on average. That relationship has held through multiple economic shocks, suggesting gold functions as a lasting store of purchasing power relative to other real goods.
What Most Investors Miss About Purchasing Power and Gold
Many view gold simply as an inflation hedge that rises with CPI and falls when CPI cools. That view is incomplete. Gold’s value is closely tied to real interest rates — the nominal rate minus inflation. When real rates are low or negative, holding non-yielding assets like gold becomes relatively more attractive because the opportunity cost of holding gold falls.
Gold’s most important role is multi-decade preservation of purchasing power, not short-term trading against headline CPI. Investors focused on weekly price moves are watching short-term volatility; those who hold gold for structural reasons focus on what an ounce will buy in the years ahead as money supply and financial balances evolve.
Why Gold’s Rise Since 1971 Is Not What Most People Think
Gold’s increase in dollar price since 1971 reflects the dollar’s decline, not a miraculous change in gold itself. Going from $35 per ounce to multi-thousand-dollar levels over five decades is the dollar’s inflation record expressed in ounces: the measuring stick (the dollar) has expanded, so the measured object (gold priced in dollars) appears to have risen.
What Does Purchasing Power Erosion Mean for Long-Term Savers?
For long-term savers, purchasing power erosion is a practical certainty if a large share of wealth is held in cash or fixed-income instruments over decades. At an average inflation rate near historical post-1971 levels, a fixed sum can lose half its real value in roughly two to three decades. That mathematical reality matters for retirement planning and wealth preservation.
Why the Official Inflation Number Understates the Problem
Official averages mask distributional effects. Housing, healthcare and education—costs that heavily influence household budgets—often rise faster than the headline CPI. Meanwhile, financial assets and real estate tend to appreciate early when new money enters the system. Savers who hold only cash and bonds can therefore lose purchasing power both from rising living costs and from missed asset appreciation.
Physical gold addresses these issues by sitting outside the fiat system, carrying no counterparty risk and resisting dilution by monetary policy. Many central banks have increased gold holdings because they consider it a strategic hedge against long-term purchasing power erosion.
Stay On Top of Gold & Silver Prices
Get important market alerts sent straight to your inbox.
People Also Ask
What is purchasing power in simple terms?
Purchasing power is how much real stuff a dollar can buy at a given time. When prices rise faster than income, purchasing power falls — meaning money buys less even though its nominal amount is unchanged. The BLS measures this with the Consumer Price Index: when the index rises, each dollar’s purchasing power has declined.
Why does fiat currency lose purchasing power over time?
Fiat currency loses purchasing power because its supply is not physically limited. Governments and central banks can expand money through bond purchases, lending and reserve policies. When more money chases the same goods, prices rise and each existing unit buys less. Since the end of gold convertibility in 1971, the dollar’s purchasing power has declined substantially by CPI measures.
How does gold preserve purchasing power?
Gold preserves purchasing power because its supply is constrained by geology and mining capacity. No policy can quickly increase global gold supply. This scarcity helps an ounce of gold retain similar purchasing power over long spans of time, and academic research supports that gold-denominated comparisons remain meaningful across eras.
How much purchasing power has the dollar lost since 1971?
Based on CPI-U measures, the dollar has lost about 87% of its purchasing power since August 15, 1971. That means items that cost $1 then cost roughly $8 now. The decline unfolded over decades, with acceleration at times such as the 1970s oil shocks, post-2008 monetary expansion, and the 2020–2022 period of rapid money supply growth.
What is the Cantillon Effect and how does it affect savers?
The Cantillon Effect describes how new money enters the economy unevenly. Early recipients—banks and large financial players—use the new money before prices rise, allowing them to buy assets at earlier prices. Ordinary savers receive the benefits later, after prices have increased, effectively transferring wealth toward those with first access to newly created money.
SOURCES
1. Bureau of Labor Statistics — Consumer Price Index (CPI) reports and CPI-U series.
2. Federal Reserve data — money supply (M2) series and monetary statistics.
3. World Gold Council — analysis of global gold supply and central bank purchases.
4. Erb, Claude B. and Harvey, Campbell R. — research on gold and historical comparisons.
5. Historical commodity data — gold-to-oil ratio and long-term comparisons.
6. Richard Cantillon — essay describing the mechanics of how new money affects an economy.
7. Defense Finance and Accounting Service — contemporary military pay tables for wage comparisons.
Disclaimer: This article is for informational purposes only and does not constitute financial or investment advice. Consult a qualified financial adviser before making investment decisions.
You May Also Like:
- Why Hong Kong? Inside Offshore Gold Storage Networks
- Silver Price Outlook July 2026: Two Catalysts, One Setup
- Why the 10-5-3 Rule Fails Precious Metal Investors
- Why Is Silver So Hard to Mine? The Primary Supply Problem Explained
- Gold Price Outlook July 2026: The Price Fell. Case Intact.
- Buying the Top: A Survival Guide for Gold and Silver Investors
- How Do Gold Price Cycles Work? A Framework Across Four Time Horizons