Gold Prices Moved on Iran News — Iran Was Not the Driver
Key Takeaways
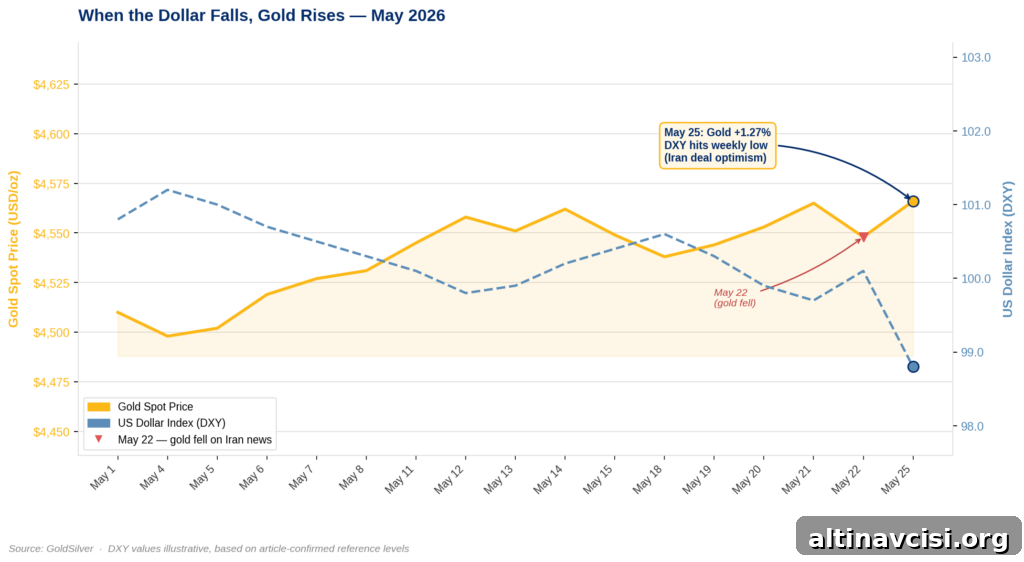
- Gold rose $57 (+1.27%) to $4,565.99 on May 25 as the U.S. dollar weakened. The weakening dollar, driven in part by optimism about a potential US–Iran agreement affecting the Strait of Hormuz, made gold less expensive for buyers who do not transact in USD.
- The reported Hormuz framework remains unresolved. Officials have said negotiations are incomplete: outstanding issues include sanctions relief timing, Iran’s nuclear commitments, and post-ceasefire control of shipping lanes.
- The long-term drivers for precious metals remain intact: large U.S. federal debt, currency debasement over decades, and continued central bank buying. Short-term headlines can move prices, but they do not replace the structural story.
The same Iran-related headlines produced two different market reactions in three days. On May 22, reports of diplomatic progress weighed on gold; by May 25, similar reports helped push the metal higher. Understanding why identical news can lead to opposite outcomes requires looking at which market variable each move reflected.
On Memorial Day, with U.S. equity and Treasury markets closed and London setting the price, gold climbed $57 to $4,565.99 after weekend reports that the U.S. and Iran had “largely negotiated” a framework to reopen the Strait of Hormuz. The contrast to the May 22 reaction is instructive: headlines were the same, but the market context differed.
Why Did Gold Fall on Iran News Three Days Ago?
The decline on May 22 was driven primarily by inflation expectations. Peace prospects lowered the risk of a prolonged supply shock to oil, which reduced near-term inflation pressure. That eased the argument for gold as an inflation hedge, and markets slightly adjusted interest rate expectations. A small decline in gold followed — a rational response to a marginal change in one important variable.
Importantly, that dip did not represent a loss of faith in gold’s longer-term role. It reflected a temporary shift in inflation outlook. Structural support remained in place even as investors reassessed one piece of the macro picture.
Why Is the Same Story Pushing Gold Higher Today?
On May 25 the dominant variable was the U.S. dollar rather than inflation. The same positive news about Hormuz pressure drove oil lower again, but the larger market knock-on was currency markets: the U.S. dollar index fell to a one-week low. Because most global gold buyers do not price in dollars, a weaker dollar makes gold cheaper in local-currency terms and increases buying power for international buyers.
Think of buyers in Japan, Germany, and India: when the dollar softens, each unit of their currency converts into more dollars and thus into more gold. That immediate change in effective purchasing power raises demand and pushes the dollar-denominated gold price higher. This inverse relationship between gold and the dollar is longstanding and explains how the same Iran headlines produced two opposite moves when different market levers were dominant.
What Is the Gold–Silver Ratio Signalling?
Silver rose more sharply on May 25, gaining 3.1% to $77.87 and tightening the gold–silver ratio from about 60 to roughly 58.6. When silver outperforms gold by that magnitude, it often signals a shift in market tone: either growing risk appetite, renewed industrial activity, or both.
Lower oil reduces some input costs for manufacturers, while a weaker dollar makes industrial metals more affordable across Asian markets. If supply constraints tied to the Hormuz disruption ease, that can further bolster industrial demand. Historically, compressions of the gold–silver ratio have preceded strong silver runs, and the recent move looks like more than a fleeting one-day trade — it may reflect early positioning for renewed economic activity.
Is the Hormuz Deal Actually Going to Happen?
Markets have priced in a deal, but the facts remain incomplete. Officials have described negotiations as unfinished. Key issues still open include the timing and scope of sanctions relief, Iran’s commitments on nuclear matters, and arrangements for control of shipping lanes after any ceasefire. Statements from U.S. and Iranian sources suggest the framework is not fully settled.
That reporting gap — between “largely negotiated” and a final signed agreement — is the point where many deals fail. If the framework ultimately collapses and oil prices spike, inflation expectations could rise, the dollar could strengthen, and gold’s rally driven by currency weakness would likely reverse. Conversely, if the deal holds while central banks and policymakers respond differently, several moving parts could still support precious metals.
Another important variable that receives relatively little attention is the European Central Bank. ECB officials have warned they will act if energy-driven price pressures threaten eurozone inflation. That can influence the euro–dollar dynamic: a more hawkish ECB path would tend to strengthen the euro, weaken the dollar, and amplify the same currency-driven mechanism that lifted gold on May 25.
Watch the coming data and diplomacy closely. Next week’s Personal Consumption Expenditures (PCE) index — the Fed’s favored inflation measure — is a key signal. Any public comments from U.S. officials or additional negotiating developments will also be important.
What Does Today’s Move Mean for the Long-Term Case?
Daily headlines move prices; they don’t change the structural case for precious metals. That backdrop includes large U.S. federal debt, ongoing monetary accommodation tensions, long-term dollar purchasing-power erosion since the early 20th century, and persistent central bank buying of gold. Those forces operate on a multi-year horizon and are not overturned by a single news cycle.
Short-term traders should pay attention to the interplay of currency moves, inflation data, and geopolitical developments. Longer-term investors remain focused on balance-sheet dynamics, central bank reserves, and real interest rates. The recent dollar-driven rally is consistent with these broader patterns: short-term catalysts can accelerate moves, but deeper trends provide the base case.
Prices at 12:48 UTC, May 25, 2026 — Gold: $4,565.99 (+1.27%); Silver: $77.87 (+3.11%).
Stay On Top of Gold & Silver Prices
Get timely market alerts and analysis delivered to your inbox.
Receive concise updates on price moves, macro drivers, and geopolitical developments that affect precious metals.
SOURCES
1. nFusion Solutions — Live spot price feed
2. CNBC — Reporting on U.S.–Iran talks
3. Reuters via Al-Monitor — Statements from U.S. officials
4. NPR — Coverage on peace negotiations and risks
5. Bloomberg — ECB comments on price stability risks
6. European Commission — Spring 2026 economic forecast
7. Reuters via Investing.com — ECB commentary and risk assessments
8. U.S. Congress Joint Economic Committee — Monthly debt update, May 2026
9. Federal Reserve Bank of Minneapolis — Historical price-level data
10. World Gold Council — Central bank gold demand trends and historical price data
Disclaimer: This article is informational only and is not financial or investment advice. Consult a qualified financial advisor before making investment decisions.
You May Also Like:
- Gold Falls 0.5% on Iran Deal: The Floor Holds
- Is Gold Being Repriced? Five Major Institutions Say Yes
- Silver Dropped 12%. Gold Dropped 3%. That Gap Is the Story.
- Gold Price Holds Firm After Hawkish Fed Minutes — Here’s Why
- Why London Still Sets the Gold Price — and Asia Doesn’t
- Gold Price at ~$4,502: Is the Dip a Buy? BofA Says $6,000
- Gold Didn’t Fall on Iran Peace News. That’s the Point.
- Trump Called Off the Strike. Gold’s Real Risk Is Still $39 Trillion.
Popular Topics
Picked from the archive
-
01
 Topics
Moody’s Economist: US Economy Nears Recession After Jobs Plunge
-
02
Topics
Insurance vs Upside: How Gold and Silver Balance Your Portfolio
-
03
Topics
World Gold Council: Gold Eyes $3,351 as Triangle Break Nears
-
04
Topics
Could the U.S. Government Seize Your Gold Again?
-
05
Topics
How Kevin Warsh as Fed Chair Could Affect Gold Prices
-
06
Topics
Gold at $4,481 as Rate-Hike Risk Rises: NFP Decision Map
-
07
Topics
Should You Invest in Gold in 2026: Bars, Coins, IRAs or ETFs?
-
08
Topics
Tariffs Drive Gold Premium Over $100 Between New York and London