Gold Jumps $90 After June CPI Report
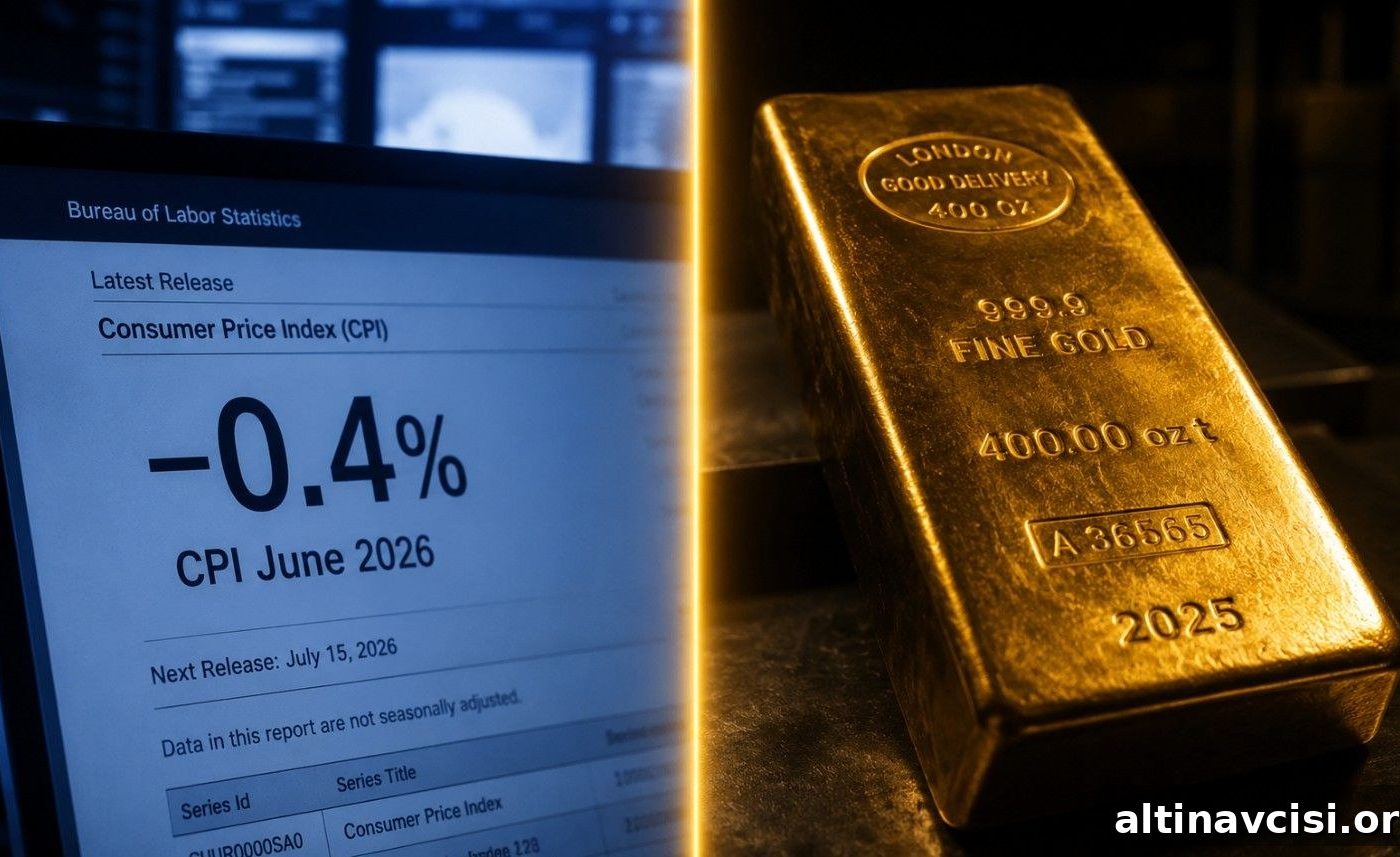
June’s inflation report showed the largest single-month drop in Consumer Price Index readings since April 2020. On a seasonally adjusted basis, headline CPI fell 0.4 percent in June, well below the 0.1 percent decline many economists had expected. That drop was driven almost entirely by energy — gasoline prices fell nearly 10 percent after a brief ceasefire with Iran temporarily reopened the Strait of Hormuz.
What Did the Gold Price Do After June CPI?
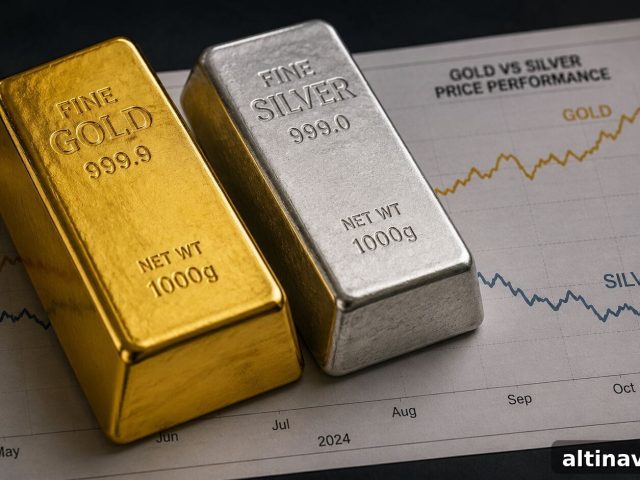
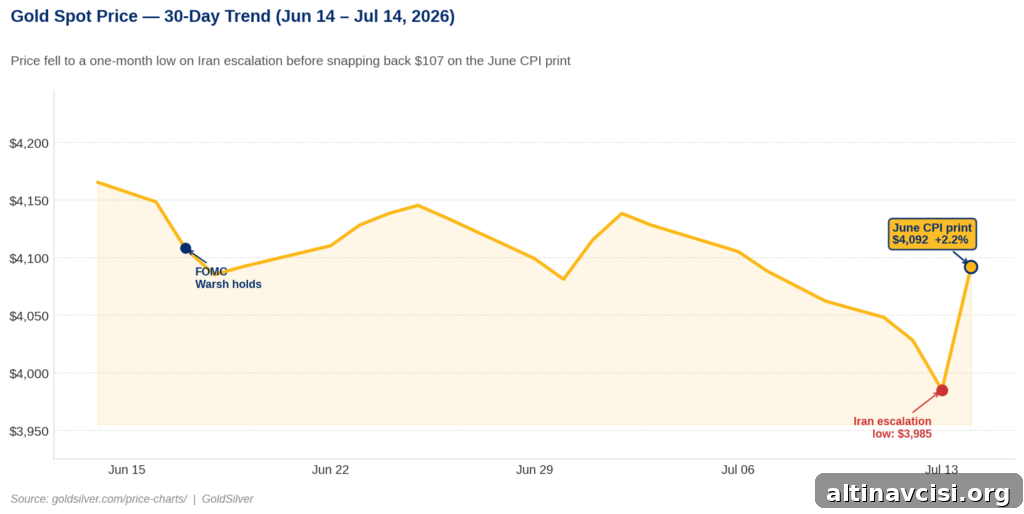
Gold reacted quickly to the softer inflation print. Spot gold moved higher, trading around $4,091 per ounce — up roughly $90, or about 2.25 percent, in early U.S. trading after the CPI release. Earlier in the week gold had fallen amid renewed tensions in the Strait of Hormuz; this morning’s inflation surprise reversed much of that risk-driven move. Silver climbed as well, reaching approximately $59.39, gaining around 3 percent on the session.
Why Did June CPI Send Gold Higher?
The link runs primarily through real yields. Because gold does not pay interest, its appeal is inversely related to real rates — that is, nominal Treasury yields adjusted for inflation expectations. When inflation unexpectedly drops, markets reassess the likelihood of further interest-rate hikes. Softer inflation tends to push nominal yields lower, which compresses real yields and reduces the opportunity cost of holding non-yielding assets like gold. Lower real yields make gold relatively more attractive, and prices typically rise.
Prior to the report, a number of Federal Open Market Committee participants had signaled the possibility of additional rate increases later in the year. That hawkish positioning weighed on precious metals through June. A surprisingly weak inflation print, and in particular a flat core CPI reading for the month, strengthens the argument for those policymakers who favor holding policy steady. As investors and traders reprice the odds of near-term hikes, the probability of a rate increase in September is likely to fall, supporting the recent rally in gold and silver.
Stay On Top of Gold & Silver Prices
Get important market alerts sent straight to your inbox.
What the Headline Number Isn’t Telling You
The headline decline requires careful scrutiny before declaring victory against inflation. Nearly the entire monthly drop came from the energy component — most notably a 9.7 percent decline in gasoline. Shelter, a large and persistent part of the CPI basket, rose 0.1 percent in June, the smallest monthly increase since January 2021. Meanwhile, core CPI (which excludes food and energy) was flat for the month. While a flat core reading suggests headline inflation is not accelerating, it does not yet demonstrate a clear, durable reversal in demand-driven inflation components such as services, wages, and shelter.
Importantly, the ceasefire that produced the gasoline relief ended on July 8. Subsequent U.S. military actions against Iranian targets have pushed oil prices back toward the levels that contributed to May’s larger headline increase. In short, the energy relief shown in the June report is already being eroded. July’s CPI — released in August — is likely to reflect renewed pressure from higher oil prices if that trend continues.
Does One Good CPI Print Change the Structural Case?
No. One monthly print does not overturn the broader structural picture. On a year-over-year basis, core CPI remains elevated compared with the Federal Reserve’s 2 percent target, and shelter inflation continues to be a persistent source of upward pressure on overall consumer prices. The Fed faces a difficult trade-off: inflation readings above target on parts of the price index while geopolitical risks keep energy prices volatile. That environment limits the central bank’s ability to tighten policy aggressively without risking other economic damage. As a result, real yields are likely to remain constrained for some time, which is supportive of precious metals whether rates stay steady or rise only modestly.
The Second Corner: Why This Print Is Backward-Looking
An important structural point is that CPI is inherently backward-looking: it measures prices that prevailed over the previous month. June’s report captured a period when the Iran ceasefire was in effect and gasoline prices were falling. That specific geopolitical condition has since changed. With the Strait of Hormuz once again contested and oil prices on the rise, the temporary inflation relief recorded in June will likely fade. Monetary policy can influence demand through interest rates, but it cannot directly resolve an oil supply disruption. That mismatch — between the source of inflation and the tool designed to combat it — helps explain why the Fed remains constrained and why tangible stores of value, like physical precious metals, often retain appeal in such circumstances.
What to Watch Next
Short-term market reaction will hinge on how policymakers and key speakers interpret the data. Federal Reserve testimony and official comments in the hours and days following the CPI release can shift expectations for policy. A tone emphasizing data-dependence and patience would likely support the recent relief rally in metals, while a hawkish framing focused on sticky core measures and ongoing geopolitical risks could limit gains. Looking ahead, upcoming central bank meetings and the Fed-favored inflation gauge — the Personal Consumption Expenditures (PCE) index for June — will be important milestones to watch for a clearer picture of the inflation trajectory.
SOURCES
1. Bureau of Labor Statistics — Consumer Price Index, June 2026 (USDL-26-1191, July 14, 2026).
2. Bureau of Labor Statistics — Consumer Price Index, May 2026 (USDL-26-0824, June 10, 2026).
3. Federal Reserve — FOMC Statement and Summary of Economic Projections, June 17, 2026.
4. CME Group — FedWatch Tool, rate probability estimates as of July 14, 2026.
5. Live gold and silver spot price data as reported on July 14, 2026.
Disclaimer: This article is for informational purposes only and does not constitute financial or investment advice. Consult a qualified financial adviser before making investment decisions.
You May Also Like:
- Silver Fell 3.8% Today. Gold Fell 2.9%. The Gap Has a Name.
- Trump’s Hormuz Toll Is an Inflation Tax. Here’s Why Gold Fell.
- Gold Fell 1.4% on an Iran Strike. One Number Tomorrow Morning Could Change Everything.
- Trump Declared the Ceasefire Over. Gold Barely Moved.
- HSBC Cut Its Gold Forecast by $304. Then Said Gold Will Hit $4,750 by Year-End.
- The Fed Named AI Its Top Inflation Risk. Gold Noticed.
Popular Topics
Picked from the archive
-
01
 Topics
Why Silver Falls More Than Gold and What It Means for Investors
-
02
Topics
CPI-Adjusted Silver vs Spot Price: What the Ratio Reveals
-
03
Topics
Gold’s Bull Run: Fed Rate Cuts and China Buying Drive $5K Target
-
04
Topics
Gold and Silver Prices Jump After Iran Peace Deal, Then Retreat
-
05
Topics
Why Trump’s Hormuz Toll Raised Inflation and Pushed Gold Down
-
06
Topics
Thursday PCE Drop: How It Affects Gold Prices
-
07
Topics
Silver Shortage Looms as Solar and EV Demand Soars
-
08
Topics
Gold Holds After CPI and PPI Miss: Market Impact Explained