Gold Fell 9% as Stocks Dropped 6%: The Two Forces at Play

Gold has dropped sharply over a recent run of trading days, falling roughly 9% across six consecutive sessions that coincided with losses in the S&P 500, which declined about 5.8% over the same period. The moves reflected a mix of market forces: expectations for higher Federal Reserve interest rates on some days and forced selling on others. As of Friday, November 20, 2026, spot gold was trading near $3,572 per ounce.
Key Takeaways
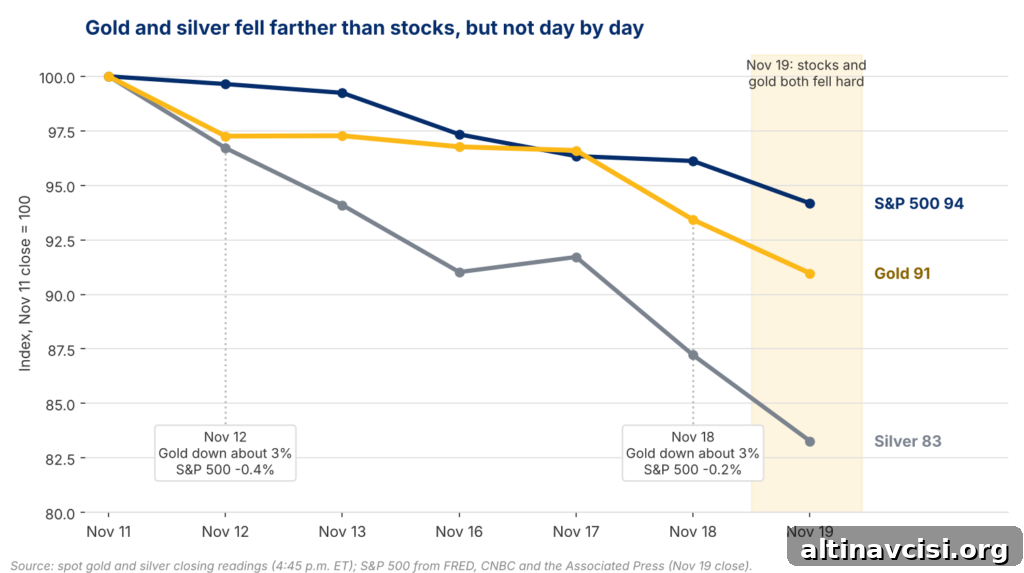
- Between the November 11 and November 19 closes, gold fell about 9% and silver approximately 17% by the 4:45 p.m. ET readings, while the S&P 500 declined roughly 5.8%.
- Gold and stocks did not always move in lockstep day by day. For example, gold dropped around 3% on November 18 when stocks fell just 0.2%, while on November 16 gold fell only about 0.5% while stocks lost nearly 1.9%.
- The most pronounced joint decline occurred on Thursday, November 19, when both gold and stocks fell sharply together.
How Far Has Gold Fallen Compared With Stocks?
Since the end of September, gold has declined about twice as much as the S&P 500. Through Thursday’s close, gold was down roughly 13% and silver about 29%, while the S&P 500 was down near 6.2%, based on closing figures reported by major news organizations. Spot gold touched a near-term low in the $3,500 range and silver traded near $42 an ounce during the same stretch. The S&P 500 recorded a sixth straight daily loss on Thursday, highlighting the breadth of market weakness during the period.
Did Gold Fall on the Same Days Stocks Fell?
Not consistently. While stocks and gold both fell on some days, the magnitude often differed sharply. For instance, stocks dropped similar amounts on November 16 and November 19, yet gold’s decline on the 19th was roughly five times larger than on the 16th. Two of gold’s biggest single-day drops in the run came on days driven by Fed-related developments (November 12 and November 18). That pattern shows there isn’t a single explanation for gold’s slide — multiple drivers were at work at different times.
What Pulled Gold Down on the Fed Days?
On days when Fed expectations moved markets, rate-hike probabilities and a stronger dollar were key headwinds for gold. Stronger-than-expected inflation data and hawkish Fed commentary pushed investors to expect further tightening, boosting the dollar and increasing the odds of rate hikes. Specific remarks from Fed officials and minutes showing broad support for additional hikes reinforced that view. With the dollar near a multiyear high, the pressure on dollar-priced gold intensified—higher expected interest rates and a firmer currency typically weigh on non-yielding assets like gold.
Do Rising Yields Explain the Drop?
Rising real yields help explain part of gold’s decline but do not account for the full move. The real yield—commonly measured as the 10-year Treasury yield minus expected inflation—rose modestly in the period, and long-run research suggests such moves should subtract roughly $120 to $165 per ounce from gold’s price. Gold’s total drop over the stretch was larger, meaning real yields explained only about 30% to 40% of the decline based on those long-run estimates. Additionally, some days saw metal prices fall even as Treasury yields eased, indicating other forces such as liquidity demands and investor positioning were also relevant.
Why Would Gold Be Sold When Stocks Break?
Gold can be sold during stock routs primarily because it is highly liquid and easy to sell quickly. When leveraged investors face losses and margin calls, they often sell holdings that can be converted into cash fastest, and that frequently includes liquid metals and other readily tradable assets. The same dynamic pushed gold lower in past sharp sell-offs; forced liquidations can temporarily pull gold down alongside risk assets even though gold is often viewed as a safe haven over longer horizons.
Market commentary has noted that recent technology-related sell-offs and algorithmic trading may have amplified forced liquidations, contributing to larger moves in gold on certain days. While margin calls cannot be observed directly, the timing and scale of price moves are consistent with episodes of forced selling.
Who Is Selling Gold, and Who Is Buying?
The selling appears concentrated among leveraged and short-term holders, while physical buyers—particularly in major bullion markets—have stepped in to buy the dip. Reports from market observers indicate that lower prices have encouraged additional physical demand in key consuming countries, where bargain hunters often increase purchases when rates fall. Physical owners are not subject to margin calls in the same way as leveraged traders, although they still experience mark-to-market losses until prices recover.
What Would Show Which Force Is Winning?
To gauge whether Fed-driven macro forces or forced liquidations are dominating, watch how gold behaves on days when stock market direction and Fed/dollar signals diverge. If gold continues to fall while stocks rise, the Fed/dollar influence is likely stronger. Conversely, if gold stabilizes while stocks continue to slide, forced selling may be easing. Tracking daily correlations among gold, equities, the dollar, and real yields over the coming weeks will help clarify which drivers are most influential.
Stay On Top of Gold & Silver Prices
Get important market alerts sent straight to your inbox.
SOURCES
1. Reuters via CNBC — Gold slides toward worst week in eight months on hawkish Fed outlook
2. Reuters via CNBC — Dollar near 19-month high, set for weekly gains as market jitters spur haven bids
3. Associated Press via The Washington Post — How major US stock indexes fared on 11/19/2026
4. Federal Reserve Board — Minutes of the Federal Open Market Committee, October 27–28, 2026
5. CNBC — Fed official comments on potential larger rate moves
6. Reuters via Business Recorder — Gold falls to over one-week low on firm dollar and rate-hike bets
7. Federal Reserve Economic Data (FRED) — 10-Year Treasury Inflation-Indexed Security, Constant Maturity
8. Federal Reserve Economic Data (FRED) — S&P 500 series
9. World Gold Council — Research on gold and reserve management during market stress
10. Morgan Stanley Research — Analysis of gold’s sensitivity to monetary policy
11. Federal Reserve Bank of Chicago — Research on drivers of gold prices
12. PIMCO — Educational material on understanding gold prices
13. CNBC — Coverage of September market performance and inflation impacts
Disclaimer: This article is for informational purposes only and does not constitute investment advice. Past performance does not guarantee future results. Consult a qualified financial advisor before making investment decisions.
You May Also Like:
- How Low Can Gold Go After Falling Below $3,700?
- Silver Buy Signal: Why Some Analysts See an Opportunity
- Why Gold Fell After a Big Tech Earnings Beat
- Why Some Investors Keep Buying Gold Even as Prices Fall
- Gold’s Reaction to Hot CPI: Alternative Indicators to Watch
- Physical Gold vs. ETFs vs. Mining Stocks: What Suits Different Investors?
- Comparing Large Gold Drawdowns: Is This Like 2008?
- How Fed Decisions Have Reshaped Views on Gold
Popular Topics
Picked from the archive
-
01
 Topics
Manufacturing Hits Strongest Month of 2026 as Gold Plunges
-
02
Topics
Why Gold Should Watch the World’s Last Zero-Rate Anchor
-
03
Topics
IMF: Treasuries Are No Longer Safe, Gold Reacted First
-
04
Topics
Silver Outperformed Gold in August: Few Investors Noticed
-
05
Topics
Institutions Are Buying as Bond Yields Rise: What It Means
-
06
Topics
China Gold Imports via Hong Kong Surge 28% Amid Mixed Demand
-
07
Topics
2026 Silver Deficit Forecast Shrinks as Market Tightness Eases
-
08
Topics
Gold Hits 3-Month High, Silver 2-Month High: What’s the Link?