Gold ETFs Lost 45 Tonnes as Central Banks Net 289: Why It Matters
Gold spot price today: $4,047 per ounce, according to goldsilver.com/price-charts.
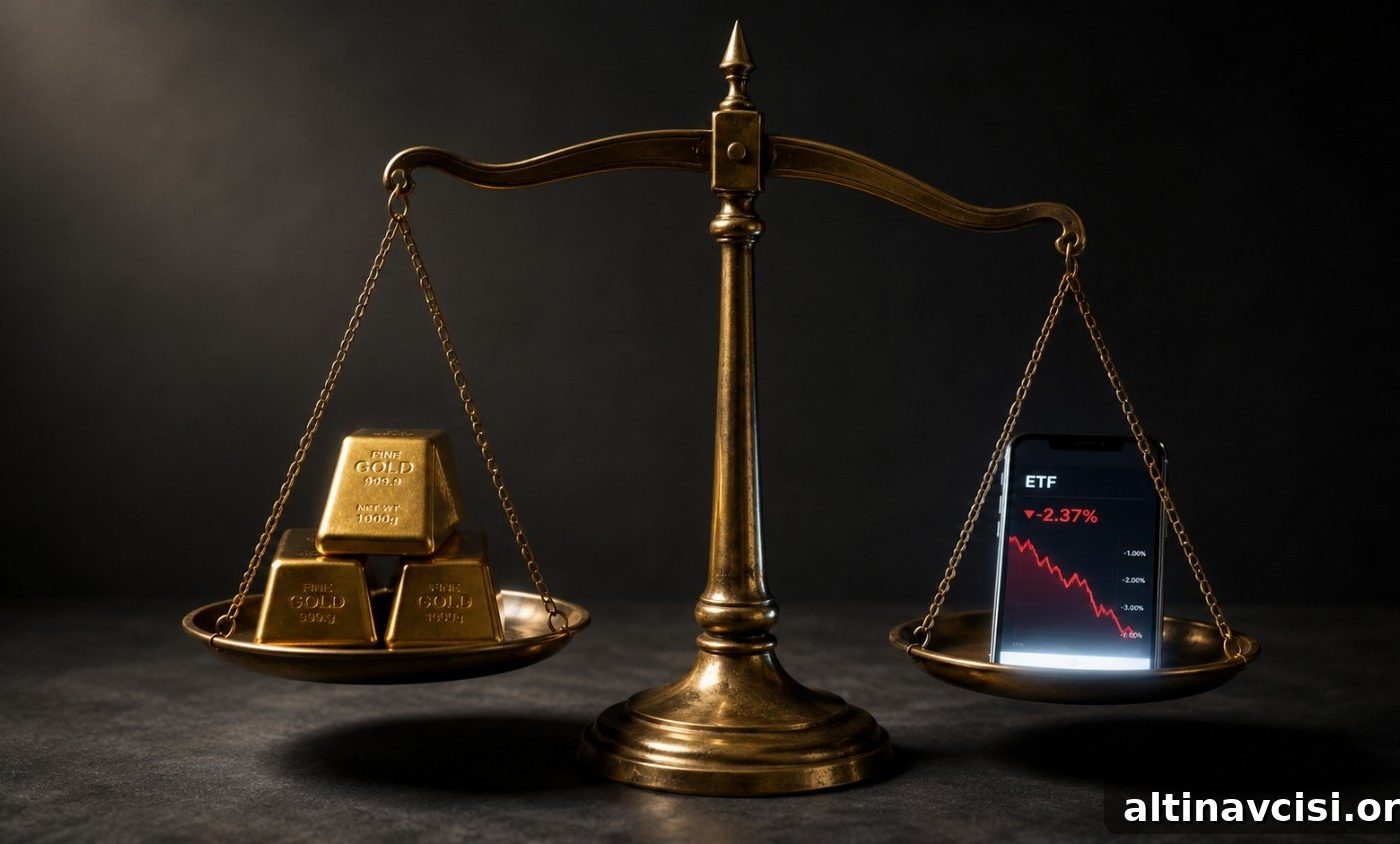
In the second quarter of 2026 two very different groups of buyers surveyed the gold market and reached opposite conclusions. One group pulled 45 tonnes out of gold ETFs; the other added 289 tonnes to official reserves and physical holdings.
That split is the central finding of the World Gold Council’s Q2 2026 Gold Demand Trends report.
Why Did Gold ETF Investors Sell in Q2 2026?
Gold-backed exchange-traded funds recorded net outflows of 45 tonnes in Q2 2026, according to the World Gold Council’s report. The WGC highlights several drivers: weaker gold prices during the quarter, rising inflation and higher rate-hike expectations in North America, and a stronger US dollar.
Put simply, many ETF investors were betting on tighter monetary policy. When inflation expectations climb, the Federal Reserve typically tightens policy, which pushes real yields higher. Since gold does not pay interest, a rise in real yields reduces its relative appeal compared with yield-bearing assets such as bonds. That dynamic encouraged paper-market sellers to reduce exposure.
This is a short-term, performance-driven response. ETF managers and institutional traders often focus on quarterly results and near-term signals; during Q2, those same macro forces pushed the gold price down by roughly 14%. For investors managing shorter horizons, selling gold in that environment was a rational trade.

The Edge Every Investor Needs
Smarter precious metals investing starts here. The Nuggets Newsletter delivers essential market insight, Fed updates, global trends, educational videos, and timely analysis.
Why Are Central Banks Still Buying Gold at These Prices?
Central banks added 289 tonnes of gold in Q2 2026, a 62% increase from the same quarter a year earlier, per the World Gold Council. Importantly, that accumulation occurred while gold prices were broadly declining.
The WGC reports the average LBMA gold price in Q2 was $4,506 per ounce, below the January peak — and yet central bank buying continued at pace. The explanation is straightforward: central banks manage reserves with multi-decade horizons, not quarterly performance metrics. These institutions buy gold as a long-term hedge against currency debasement and broad monetary risk.
Q2’s 289 tonnes represents a record high for any second quarter in the WGC series. Poland was the largest individual buyer in Q2, adding 51 tonnes. China’s central bank purchased 33 tonnes, its biggest quarterly buy since late 2023. The WGC emphasizes that central bank sentiment toward gold “remains exceptionally strong” — a clear signal that this is a strategic reserve policy rather than a short-term trade.
What Does the ETF vs. Central Bank Divergence Tell You?
The contrast between ETF outflows and central bank purchases is striking: central banks bought more than six times the gold that ETFs sold in Q2. The two groups were operating with very different time frames. ETF holders were reacting to near-term expectations about US monetary policy and real yields; central banks were accumulating for long-term reserve management.
Both sets of actors reviewed the same data but reached opposite conclusions. The World Gold Council notes that Western ETF flows are “more closely linked to real yields, US monetary policy expectations and the dollar,” which means ETF demand will likely continue to track Fed signals in the near term.
Taken together, the divergence is structural: it reflects a split between short-term, paper-market behavior and long-term, physical-market conviction.
Gold demand by buyer group, Q2 2026 (tonnes) — Source: World Gold Council, Gold Demand Trends Q2 2026
Did Any Other Groups Buy Gold in Q2 2026?
Yes. Beyond central banks, private buyers in over-the-counter markets were major net purchasers. OTC and other investment demand reached 327 tonnes for the quarter, much of it attributed to Asian investors who generally prefer buying physical metal directly rather than through ETFs.
Physical demand for bars and coins remained strong at 307 tonnes, down only 3% year-on-year. By contrast, gold jewellery demand fell to 278 tonnes — the lowest quarterly volume since the pandemic — as high prices made some purchases less affordable. However, the total value spent on jewellery rose by 14%, as consumers shifted toward higher-quality items.
Overall, total gold demand including OTC channels held steady year-on-year at 1,269 tonnes, and the first-half value of demand reached a record $380 billion. Those figures underline that physical demand remained robust even while paper-market flows moved in the opposite direction.
What Does This Mean for the Structural Case for Gold?
The Q2 2026 data highlights a structural reality often missed in daily price coverage: gold’s market is driven overwhelmingly by monetary and reserve considerations rather than industrial use. Industrial demand accounts for roughly 10% of annual gold demand, so price movements are mainly a function of confidence in fiat currencies and the opportunity cost of holding a non-yielding asset.
When the Fed signals higher interest rates, paper-market participants tend to sell, which pushes prices down in the short term. But reserve managers in places such as Warsaw or Beijing are focused on the dollar’s reliability and monetary stability over decades, and that perspective does not shift from quarter to quarter.
Q2 shows both forces operating at once: the paper market reacted to expected Fed tightening, while the physical market — central banks, OTC investors, and coin buyers — continued to accumulate. For investors planning on a five- to ten-year horizon, the more relevant question is which group’s judgment is likely to prove correct over that multi-year time frame.
Stay On Top of Gold & Silver Prices
Receive important market alerts and concise analysis directly to your inbox.
SOURCES
1. World Gold Council — Gold Demand Trends Q2 2026
2. World Gold Council — Gold Market Shows Resilience as Price Momentum Cools in Q2
3. GoldSilver — Live Gold and Silver Spot Prices
4. CME Group — FedWatch Tool
5. Bureau of Economic Analysis — Personal Income and Outlays, June 2026
Disclaimer: This article is for informational purposes only and does not constitute financial or investment advice. Always consult a qualified financial adviser before making investment decisions.
You May Also Like:
- Gold Had Every Reason to Rally Today. It Didn’t. Five Reasons Why.
- Central Banks Bought 289 Tonnes of Gold Last Quarter. Prices Were Falling the Whole Time.
- Warsh Said the PCE Drop Was “Not Much” of a Consideration. Gold Agreed.
- What the Fed Hold Means for Gold & Silver: Five Signals That Define the Next Six Weeks.
- Oil Spiked 8%. Gold Went Up Anyway. Why This Time Is Different.
- Gold Is Up $40. What the 9-3 Fed Vote Actually Means.
Popular Topics
Picked from the archive
-
01
 Topics
Official US Data Show Government Is Insolvent
-
02
Topics
Silver Price Spikes to $69.85, FOMC Erases Gains
-
03
Topics
Switzerland’s Gold Freeze: What Investors Need to Know
-
04
Topics
Gold Surges to $4,480 as Physical Demand Hits 50-Year High
-
05
Topics
Why Gold Prices Fell in March 2026 During the Oil Shock
-
06
Topics
Could Gold’s Consolidation Signal a Buying Opportunity?
-
07
Topics
Gold Price Falls Today: Why $4,500 Holds as Support
-
08
Topics
Gold Holds After CPI and PPI Miss: Market Impact Explained